Tuesday, March 30, 2010
Gold Forwards Acting Up
src="http://pagead2.googlesyndication.com/pagead/show_ads.js">
Was looking at the Gold forward lease rates from the London Bullion Market Association (LBMA) website (you can look yourself here if interested). It looks like the 1 and 2 month lease rates have inverted for the past three trading days in a row. When you start getting into lease rates, my brain has to keep things simple so that I don't get confused. I am no Antal Fekete.
The bottom line is that when the 1 month lease rate is higher than the 2 or 3 month lease rate (the opposite of the normal situation), this can be significant. When such an anomaly only lasts for a day, it is rarely significant. When it lasts for several days in a row, it generally means significant physical Gold market tightness and suggests a pending up move in the Gold price to alleviate the shortage of physical metal and/or satiate an elevated demand for physical Gold. Is it more complicated than that? Yeah, I'm sure it is, but I can't keep up with all the nefarious paperbug schemes to sell and lease Gold one doesn't actually own and make it seem like it's a normal thing that shouldn't alarm anyone. I'm sure Nadler over at kitco.com could tell you why it is bearish for the Gold price right here and right now.
The last time a string of at least 3 days in a row of "reversed" Gold lease rates occurred in the two front months was during the early days of the Great Fall Panic of 2008. Many wanted physical Gold but there was little to be had at the advertised paper price during the panic. Gold crashed in the panic and then was right back at $1000/oz before February was over - this recovery was in a sense "telegraphed" by the long daily strings of reversed lease rates right through the fall 2008 lows in the Gold price. Prior to the fall of 2008, the last string of at least three days in a row of reversed Gold lease rates by the LBMA's measuring stick was in November and December of 2007, right before the move that took Gold from $800/oz to $1030/oz in early 2008. These strings of days with the lease rates reversed were extended in length during the Great Fall Panic of 2008 and also during the November 2007 to March bull run (even lasting into April of 2008 in the latter case). I don't claim to know what will happen next this time around with the lease rates, but I'll be watching.
Like any other data, this is only one piece of a puzzle that fits with my bullish view on Gold. Physical market tightness, reversed lease rates, poor sentiment in the Gold patch (evident due to weak public and hedge fund participation), a U.S. Dollar that is significantly overvalued relative to other colored paper debt tickets backed by nothing, a healthy correction in price, and even the negative comments I am starting to get from blog readers and others who email me convinced Gold is headed even lower because their chart analysis says so. I remain bullish and unconvinced by their bearish arguments, despite always wanting to hear from the other side why I am wrong. Call me stubborn if you want, but I still think Gold is going to surprise the majority of current market participants by blasting to a new high before the spring is over and I still think Gold stocks will outperform during this pending bull run that may have already started.
Newmont Mining (ticker: NEM) is already up about 19% off the February lows and looks to be quietly leading the Gold stocks higher. It was up significantly today despite a down day for the price of Gold. Freeport McMoran (ticker: FCX) is a copper and base metal miner that also mines Gold and made new highs today for the early uptrend that began with the early the February bottom (don't ask me why FCX often leads the Gold patch higher in the early stages of a move but it does). Of course, I placed bets with Goldcorp (ticker: GG), Yamana Gold (ticker: AUY) and the GDX and GDXJ ETFs, so this early strength by these two blue chips doesn't help me much financially but I still consider it a good sign.
I remain as biased as ever because I have already put my money where my mouth is. I can only hope to get another pay check in time to buy more stocks in the precious metals patch before the next move higher really gets going. Until the Dow to Gold ratio hits 2 (and we may go below 1 this cycle), I will become wildly bullish after every Gold price correction. Dips are buying opportunities in the Gold patch and this time will be no different.
Monday, March 29, 2010
Gold Correction Has Done It's Job
src="http://pagead2.googlesyndication.com/pagead/show_ads.js">
The job, of course, being to wash out weak hands. These hands generally consist of the public and momentum chasers/hedgies/short-term chart jocks. The public, in aggregate, always hates any asset class that is falling, rather than seeing it as a buying opportunity. Chart jocks migrate toward trending markets, and corrections are what happens when the trend takes a breather.
This snippet from a current commentary by Adrian Ash from bullionvault.com caught my attention:
"As a proportion of all open gold futures and options contracts, the net long position held by hedge funds and other large speculators fell to 11-month low beneath 30%."
Couple this with the current chart (data thru Friday's close) of the Rydex Precious Metals Mutual Fund total assets held data over the past 1 year. The total assets in this precious metals fund is a proxy for retail investor interest in the Gold patch and the lower the plot line, the lower the total assets held by the fund and thus, the lower the public interest (obviously an imperfect proxy, but a good one nonetheless):
So, if momentum chasing hedge funds and the public aren't interested in the Gold patch, who is? STRONG HANDS. These are the folks with more patience who buy the dips and create the bottom of every correction. I wonder if these folks ever leave footprints for we ants to see? Perhaps a recent 4 month chart of the GDX ETF might help:
Anyone claiming to be a contrarian in the Gold patch should have been buying over the past 2 months. Since the public and professional momentum chasing crowd is not in this fledgling Gold sector up trend yet, there is plenty of upside potential ahead in my opinion. We are also moving into the "silly season" (i.e. the April-May time frame) as Bob Hoye calls it, when animal spirits in the markets tend to run high. I think those spirits are going to migrate from the general markets into the precious metals patch (again) and create another big move higher. Once everyone is convinced the precious metals market is going to the moon, the strong hands will sell into the frenzy and create the next top. Wash. Rinse. Repeat.
Sunday, March 28, 2010
Gold Cheerleader
src="http://pagead2.googlesyndication.com/pagead/show_ads.js">
Things are as bullish as ever in the Gold market. I continue to believe that we are on the threshold of a major move higher in Gold and Gold stocks and that the fall was just a warm up. The correction has certainly dragged on longer than I thought it would, but Gold is simply building a bigger and stronger base for a more powerful upward move in my opinion.
Unlike most, I see Gold and Gold stocks launching higher and I think the general stock market will be falling during this time. It happened in 2007-March 2008, the 2001-early 2003 time frame, 1973-1974 and 1930-1932. In other words, Gold and Gold stocks' biggest cyclical bull market moves in the last century were during nasty bear markets. All those who say Gold stocks are going to fall with the general markets are thinking only of the Great Fall Panic of 2008 and forgetting the illustrious history of Gold during secular stock bear markets like the one we are in now.
I think Gold is on the threshold here and remain wildly bullish at current price levels for both Gold and Gold stocks. The current look and "feel" of our current situation reminds me of the summer of 2007. Markets are likely in a topping out process with everyone looking at the exits but hoping for a few percent more of gains out of the stock market. Everyone knows economies are in trouble but many are still fully invested, planning on exiting at the first major sign of a price break in the general markets. Just as in the summer of 2007, there was proof all around that Gold was not performing well and would be no safe haven if a bear market were to strike. Blah, blah, blah. Here's what actually happened:
There were some big down days in Gold right before the move higher in 2007 that scared many retail investors off and triggered many stop loss orders, to be sure. Here's a daily chart of the action in 2007 right before the big bull run from the mid-600s to the $1030 level:
The foreign physical markets are getting tight in Gold again, always a good sign. The U.S. Dollar is strenuously overbought and yet Gold has held its ground in U.S. Dollar terms. The long end of the U.S. bond market looks like it wants to break down over the short to intermediate term. Everything is lined up for a big bull run in Gold, the ultimate money. Someone accused me of being a Gold cheerleader the other day - Lord knows we could use a few more in this mad paperbug world. From my point of view, why would one not be a Gold cheerleader during a secular Gold bull market after a healthy correction?
Thursday, March 25, 2010
Manipulation in the Metals Market and Secular Chart Porn
src="http://pagead2.googlesyndication.com/pagead/show_ads.js">
GATA drops another information bomb on the precious metals community, as they have been doing for years. Read the piece for yourself regarding the known manipulation that every trader or investor who follows the daily moves in Gold and silver can "feel" during those early morning devastating plunges in the Gold and/or silver price that seem to come out of nowhere.
Please understand that this manipulation is sanctioned by the highest levels of the government and the non-federal, for profit federal reserve. A conspiracy theory is no longer a theory once it is shown to be true. There can be no regulation because the government is in on the manipulation. Those calling for more regulation don't get it. Fascism is by definition the union of government and corporate interests to control the productive capacity and economy of the country. The futures market in Gold and silver is just one of many examples of the federal government ignoring fraud because it is complicit in the financial crimes being committed.
Having said this, manipulation has and will continue to fail over the longer term. Gold and silver are up 300-400% over the past decade and will continue to rise. This doesn't make traders who get screwed feel any better but long term bulls should not be deterred. "Smash downs" in the Gold and silver price, as occurred this week, are a buying opportunity.
Gold will continue to trounce stocks over the longer term. Now is a great time to trade the Dow for some physical Gold and/or silver held outside the purview of fascist paper pigs. Without further ado, the secular chart porn of the day is a Gold to Dow ratio (i.e. $GOLD:$INDU) monthly chart since 1980 thru today's close:
Despite manipulations in the shorter term by da boyz, the Dow to Gold ratio will reach 2 and may well go below one before a secular bottom in this ratio is reached.
Rewarding Bad Behavior
src="http://pagead2.googlesyndication.com/pagead/show_ads.js">
is a great way to get more of it. Capitalism hasn't failed but fascism (i.e. corporatism) is failing the United States. Granted, those on the correct side of the trade can never lose, because they are made whole when their bets are wrong. When wrongful behavior is rewarded, more wrongful behavior occurs. This is known as positive reinforcement in psychology and it tends to work, all other things being equal.
The "trickle down" effect is to create a society that is devoid of concern over "doing the right thing." We all see the large banks and Wall Street firms, who were rewarded instead of allowed to go bankrupt. It is a fact that JP Morgan (the worst of the bunch even though Goldman Sachs gets all the attention), Goldman Sachs, Bank of America and Citigroup should no longer be corporations. They should have been liquidated as the "rules" of capitalism require.
If this had occurred, the economy would likely have already bottomed by this point, albeit at scary levels in the stock market, housing prices and unemployment figures. We would actually be in a position to move ahead in a positive manner from a lower level of economic activity. In other words, we would be ready to rebuild a new economy based on something besides debt, consumption and financial fraud.
Instead, we are now facing an ongoing crisis that has only just begun. The problems are hidden and papered over but nowhere close to being gone. The amount of bad mortgage debt on the balance sheet of the U.S. government is staggering. The degree of financial firm insolvency lurking off balance sheet is staggering. The entitlements waiting to be paid out to eager baby boomers is staggering. Rather than address these problems directly, the "powers that be" are acting as vultures.
The current cash value of many assets of the United States is being stripped out, leaving paper IOUs behind. This will foment further economic stagnation and/or collapse at a later date. More debt will be conjured into the air and sprinkled on the zombified economy as needed to keep the sheeple complacent. More bad behavior to hide past bad behavior.
This is the nefarious aspect of a paper fiat monetary system backed by nothing that is coming to fruition. In a very biblical sense, what has been sewn will be reaped. Absolute power corrupts absolutely and the ability to create money out of thin air is no exception. The latest move by Bank of America to generously write down principle on mortgages in Massachusetts is tainted by this same mistake of rewarding bad behavior.
From the article:
The forgiveness would be offered in two stages for the riskiest loans, including subprime loans and loans that offered borrowers multiple options for how much to pay each month.
Ineligible are 30-year fixed-rate loans.
Huh? Why would 30 year fixed mortgages be excluded? Why would those who avoided the toxic mortgage products not get the same deal as those who were either duped by these exotic products or looking to speculate? Anyone think the people who take the write down are striking a deal with the devil that in a year or two they will wish they hadn't signed?
Rewarding bad financial behavior is apparently now the norm in the United States. The rewards are asymmetric, of course, and accrue largely to those who have already purchased politicians. But we ants are observant creatures and we learn to emulate those in positions of power. Debt will no longer be respected by the ants. This trend is picking up steam and set to accelerate. Money owed? Who cares. Default. Walk away.
If you pay your debts and make good on your obligations, you are a sucker. Who needs good credit when everyone else has lousy credit? The government will step in and loan you money if you're a credit risk! The government will offer you subsidies and enticements because it is your right as an American to buy new houses and new cars whether you can afford them or not. If you can't make the payments, just stop paying and enjoy the item for free as long as possible until it is repossessed.
Financial lawlessness begets more lawlessness. The ants are starting to learn how the game works and this won't be good for banking profits over the next decade. Of course, the bonuses will still need to be paid via hook or crook...
Tuesday, March 23, 2010
Green Shoots in the Gold Patch
src="http://pagead2.googlesyndication.com/pagead/show_ads.js">
The Gold miners, as a group, have quietly lead the Gold price higher since the early February bottom (which I believe will be THE bottom for this correction). This is constructive action. Anything can change and there are no guarantees, but this is what would be expected with a fledgling uptrend.
Here is a 60 minute intraday chart of the GDXJ junior Gold mining ETF divided by the GLD Gold ETF price (i.e. GDXJ:GLD) over the past 3 months:
And here's the 2008 fall panic lows and recovery in its early stages for the $HUI:GLD ratio (I used the 1st 6.5 weeks after the bottom to show how it looked in real time):
It is also interesting to note that GDXJ is outperforming GDX since the February bottom. The Gold and Gold stock rally has to begin somewhere and I call "GREEN SHOOT!"...
I remain wildly bullish on all things precious and metal.
Monday, March 22, 2010
Government Versus Private Debt
src="http://pagead2.googlesyndication.com/pagead/show_ads.js">
A recent Bloomberg article highlights how some highly respected corporations are paying a lower interest rate than the U.S. Government for short term debt. This is an interesting and rather unusual phenomenon for the United States. This implies that investors believe "top tier, safe" corporations like Berkshire Hathaway and Procter and Gamble are less likely to default than the U.S. Government!
Since the U.S. Government has the ability to get more cash by creating it out of thin air with the help of their central banksta friends at the non-federal, for-profit, unconstitutional federal reserve, this is saying a lot. I don't know if this trend will persist or not. A bout of fear would most likely flip this relationship back to normal with the government rate being lower than any corporation. If not, we're in bigger trouble than I thought.
But this article brings up an interesting point and gets to the heart of matter when it comes to the inflation-deflation debate. For the core issue is not issuance of money or debt. It is, plain and simple, confidence. If the U.S. Government can maintain the confidence of the world, our depression will be deflationary. If they cannot, then it will be highly inflationary.
In other words, if people turn to the public sector for "safety" with investment money, then they invest in short-term government debt. This is the usual occurrence during an economic depression and is the expected outcome in most secular credit contractions. This is what has happened in Japan over the last 2 decades. Japan has stimulated itself more than a subway frotteurist at rush hour and yet one can hardly conclude that Japan has experienced heavy inflation over the past 2 decades despite all the money/debt printing there. The Japanese people, who are savers, have retained confidence in their government and purchased government bonds hand over fist. Thus, interest rates have remained low despite the oversupply of government bonds and quantitative easing ad nauseam.
Will we in America be able to save enough money and will we retain enough confidence to help support our government's policies? If we can and do, then most interest rates will remain low and most asset prices will continue to fall (i.e. the "symptoms" of deflation). If we can't or don't, in aggregate, then most interest rates and asset prices will increase (i.e. the symptoms of inflation) in our future. Though this is, of course, a bit of an oversimplification, it is more important than any economic equation. We are simply animals engaging in herding behavior, after all.
If people lose confidence in the government in aggregate, they will turn to the private sector for safety and will avoid short-term government debt and even the currency itself. This leads to aggressive inflation or even hyperinflation. I don't see hyperinflation happening any time soon in the U.S., but aggressive inflation could. The U.S. is no more of a basket case than Europe or Japan. If the top three economic blocks of the world are all in the same dire straights, there is no reason for the U.S. to face hyperinflation - that's not how it works! Currency event - yes, hyperinflation - no. Think heavily indebted European countries in the 1930s, not Zimbabwe.
The inflation-deflation debate is really largely one of confidence during an economic depression. So where does Gold fall in this spectrum? Well, it is essentially a hedge. The reasons I think Gold is going to continue to work as this secular depression grinds on are simple.
First, Gold is not backed by debt and is real money. Debt is suspect during a secular credit contraction because most debts can't be paid back and are defaulted on. Don't be fooled by the paperbugs who say Gold can't be used to buy a loaf of bread, so it's not money. T-Bills can't be used to buy bread either, but they are a cash equivalent like Gold. However, Gold doesn't require anyone to "make good" on their debt promises.
Second, Gold cannot be debased by apparatchik decree. Sure, it can be taxed or confiscated, but that assumes someone who buys physical Gold is going to admit they still own it when the government oversteps its rights. Gold goes into hiding when governments get out of hand, all the while retaining its value until a more reasonable regime comes into power. Never forget the end game of an economic depression unresponsive to standard monetary policy/insanity: hit the reset button. What does this mean? It means change the rules of the monetary system. Just like in the 1930s (when Gold was confiscated and re-pegged at a different rate to the U.S. Dollar while all of Europe abandoned the Gold standard completely) and in the 1970s (when the U.S. Dollar broke its final link to Gold), a currency "event" can jump start the economy and get things moving again during a depression. This is by no means hyperinflationary, but it is inflationary. The timing and method are the only issues if we get another hard leg or two down.
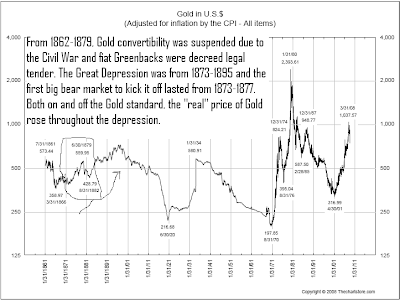
Third, Gold has proven to rise in value relative to other asset classes during previous economic depressions. In other words, the "real" price of Gold increases irrespective of the nominal price. Now, the last economic depression in the 1930s is hard to use to demonstrate this concept because the Gold price was fixed by law. So, let's take a journey back to the 1870s, which was called the Great Depression long before the 1930s hit (chart stolen from thechartstore.com):
Gold miners often outperform the Gold price in secular credit contractions because Gold miner margins rise with the "real" Gold price and they are one of the few sectors in an economy that can experience increased margins and increased demand during a depression. It's Gold miners' reward for re-liquefying an insolvent banking system. Now I know that this hasn't happened yet (i.e. miners have lagged the Gold price), but we are still very early into this economic depression and it ain't over until it's over. For those who don't want to take the risks of owning Gold miners, Gold will continue to rise in value relative to real estate, stocks, corporate bonds and government bonds. It has so far trounced the U.S. Dollar handily and I don't think that will change any time soon.
This relative value concept is hard for newer investors to grasp. If what you own as an investment simply treads water and everything else collapses in price, you have made substantial gains because you will still have money left over to buy these other assets for pennies on the dollar! This is what the Dow to Gold ratio is all about and why even paper debt-based cash is a decent investment during most depressions. If Gold stays at $1100/oz and the Dow Jones drops to 3,000, then you roughly tripled your wealth in stock terms (assuming you are willing to sell your Gold in order to buy stocks at that point). Understanding this concept means you don't have to worry about "missing" the move to Dow 15,000 if it occurs, as it implies a much higher Gold price and the percentage gain in Gold to get to its ultimate secular highs in this scenario will be multiples of 100% while the Dow would gain less than 50% to get to 15,000 from current levels.
These are longer term themes to emphasize the safety of Gold during a protracted secular bear market and secular credit contraction. The pendulum of history ain't done swinging back towards Gold - not by a long shot. I patiently await the next breakout in Gold and Gold stocks, which I continue to believe is imminent and I continue to believe will occur regardless of what the general stock market does. Not that I'm enjoying the wait...
Saturday, March 20, 2010
What Will "The Trigger" Be For Gold to Move Higher?
src="http://pagead2.googlesyndication.com/pagead/show_ads.js">
This is one of those things that doesn't matter as much as people think. Watching the daily financial news, scanning for clues, looking for justification. One of the great secrets of speculating/investing is the fact that the daily news item chosen to "explain" a move higher is not that important.
When it is time for the price to move higher, it will find a justification and news will magically appear. How many times have retail traders been frustrated to see a piece of news come out that supports their investment thesis and yet the price languishes or even moves the opposite direction of what the news would suggest. This is why Elliott Wave Theory and cycle theories are so attractive. And please note: Bob Prechter the Gold hatin' deflationist is not the only Elliott Waver out there even if he is the guru du jour. Ask Alf Field or Tony Caldaro for secular Elliott Wave peak price targets on Gold and you might not hate Elliott Wave so much as a Gold investor.
The point is not that Elliott Wave or the various cycle theories work so well, the point is that we all seek to understand why markets move up and down to gain an "edge" that allows us to profit from these moves. The daily news doesn't cut it, so people turn to cycles, alternative theories and technical analysis to try to understand what is coming next.
I continue to believe a strong upside move in Gold and Gold stocks is coming. This is based on historical patterns/fractals, fundamental analysis, sentiment data, money flows, long-term cycles, seasonal patterns and technical analysis. In other words, a hodge podge of different factors. These factors are all screaming "buy" to me when I look at the data.
Here are a few more data points for the short term. First, a chart I made in Excel based on the data that is available for free from Rydex. This is a chart of the total assets held by the Rydex Precious Metals Fund, a proxy for retail investor interest in the Gold sector (i.e. a type of sentiment data). This chart covers the last 3 years and when the blue linear plot is low, it means decreased total assets in the fund (i.e. decreased interest in the Gold sector):
Notice the last time investor interest dragged along the bottom (like it is doing now) was in the summer of 2009. Just to show how relevant this may be, let me first show you a current 6 month daily chart of the Gold Bugs' Mining index ($HUI):
And here's the action in the summer of 2009:
Or how about the time period I keep harping about - the 2001-2002 time frame? Here's the correction in late 2001 to show the daily candlestick pattern before lift-off:
And you don't have to guess what came next, the historical data is there for those interested. How about we check in on the $HUI 6 weeks later:
Along the lines of current Gold sentiment, Jordan Roy-Byrne over at The Daily Gold does some excellent work with the put to call ratios in the Gold patch. Here is a chart stolen from a piece he posted a few days ago showing the put to call ratio in the GLD Gold ETF:
Now, what news item could set this Gold market off and get it to run higher? Hmmmmmm. What if the U.S. was broke and overtly and covertly counterfeiting money to buy its own bonds and support the bond market (i.e. quantitative easing)? And then, let's say that Congress decided to meet on a Sunday to pass a new health care entitlement that would cost hundreds of billions of dollars that the government doesn't have. Ah, forget it. These scenarios are too far fetched...
Friday, March 19, 2010
More Ugly Housing Data
src="http://pagead2.googlesyndication.com/pagead/show_ads.js">
Every month, tout TV and mainstream financial sites like Yahoo! Finance and Marketwatch re-print propaganda pieces from the National Association of Realtors (NAR) and other vested interests related to real estate. The headlines are ALWAYS spun to look positive, as comfort is more important than truth. The NAR has been calling the bottom in housing every month since before the top was in! Statistics are twisted and tricks like comparing the current month to the prior month instead of the same month in the prior year are used routinely to baffle, confuse, satiate and/or soothe those who still turn to mainstream media sources for truthful data.
The numbers in housing are becoming surreal. I urge anyone who is interested in the true state of the housing market to check out this report from Lender Processing Services, Inc. (their corporate website is here). The truth will set you free as they say, though you may not like what you see if you own a home or debt on a home. Some chilling graphics and data points reproduced without permission from this current report below with my comments scribbled on the graphics:
There is more data in the report for those who are interested. This is the data the bankers and apparatchiks are using to make decisions. Add in the commercial real estate disaster and rising delinquencies on other types of consumer debt, and it is easy to see why the banking system of the U.S. is insolvent and why there will be many more bank failures.
There is no recovery in housing coming in the next few years. Things will get much worse, particularly in bubble areas. There will eventually be mass liquidations of blocks of homes in bubble areas for 10-30 cents on the dollar at the wholesale level. Rents will continue to drop, particularly in bubble areas. Don't buy a home right now thinking you are going to make a profit any time soon. There are always exceptional individual opportunities available in any area and housing fulfills a need for long-term basic shelter, which is very different than investing/speculating.
If you are a home renter, be more confident in going "month to month" once your current lease runs out and don't be afraid to ask for rent concessions as often as local conditions allow. Why? Many "investors" are buying homes so they can rent them out. Many "homeowners" who can't sell due to being underwater on their mortgage are trying to rent their vacation/second homes. Many banks would like to get into the rental business to salvage some cash flows from their rapidly growing real estate portfolios. Translation: supply pressure on the rental market will continue and rents should continue to fall.
We are following the route of Japan in the 1990s when it comes to real estate: extend and pretend, cover-ups, and massive government support of zombie banks. This is not a new playbook, it is an old recycled one. It didn't work last time and it won't work now. I forget where I stole this chart from, but it not only shows what we're in store for, but also the fact that there were indeed people who "saw it coming" (notice the final dates on this older chart) before the current mess in real estate started:
History repeats again. In the inflation-deflation debate, there is absolutely no doubt that the housing market is "in deflation" and this has bankrupted the financial industry in the U.S., which is also deflationary. The only question is how far will "the powers that be" go in trying to destroy the currency to counteract these forces? As the world's biggest debtor (the opposite of Japan in the 1990s), we don't have as much wiggle room for quantitative easing (i.e. counterfeiting money) as Japan did because we rely on external funding. Global capital flows must be taken into account when trying to decide if the Dollar will rise or fall since our own savings are inadequate to support creation of more government debt.
Serious consequences await the real U.S. economy regardless. If we do manage to get additional inflation into the system, it won't flow into housing in any significant way. Inflation moves from asset class to asset class, keeping many people in the dark regarding its pernicious effects. A bubble burst is gone and inflation won't bring it back. Gold will continue to benefit from attempts at monetary inflation that are ongoing at this point in the cycle due to the lack of confidence in the real economy and will act to protect your savings from the financial storm until the Dow to Gold ratio gets to 2 (and we may well go below 1 this cycle).
For those who already own Gold and want to buy a house in the future, here's how to know when to start looking for a house (chart stolen from Adrian Ash at bullionvault.com):
Forget the hype about a bottom and a recovery in housing. Don't worry about catching the bottom. Once we finally hit bottom, we will scrape along the lows for a few years. As in at least 2 years, maybe 5 or 10 (depends on government policies - the more they artificially prop up prices and support the market, the longer it takes to find a real bottom). There is no rush to buy and you won't miss out on the deal of a lifetime by waiting longer when it comes to real estate in the United States. Why buy now when you can buy for less later? This is asset price deflation (and a bubble collapse dynamic) in action and it ain't even close to over yet when it comes to housing.
Thursday, March 18, 2010
Copper to Gold Ratio - Warning
src="http://pagead2.googlesyndication.com/pagead/show_ads.js">
Copper price action is often used as a way to gauge economic demand. It has even garnered the nickname "Dr. Copper" for its "ability" to judge the health of the underlying economy. Copper is used in many goods including housing, cars, and manufacturing, so this sort of makes intuitive sense.
Now, like any indicator, it is not always correct. When copper "stalls out" while the stock market keeps moving higher, this is a warning sign. A daily chart of copper ($COPPER - green area plot) versus the S&P 500 ($SPX - black linear plot) during 2007-2008 gives a recent example of copper's ability (or lack thereof) to warn stock speculators:
Along those lines, copper at this point has failed to make a new intermediate term high above its January peak, unlike the stock market. Of course, I don't know if copper is going to turn around next week and make new highs or not. I am not making a specific copper price prediction here, although I wouldn't go long copper here even if the money to speculate on this outcome was given to me for free.
But I wanted to comment more specifically on the copper to Gold ratio (i.e. the copper price in U.S. Dollars divided by the Gold price in U.S. Dollars), which is a lesser known but interesting ratio chart to monitor. It is not predicting rosy times ahead for the stock market or economy on an intermediate-term basis.
Here's the copper to Gold ratio (i.e. $COPPER:$GOLD - green area plot) on a weekly chart over the past 5 years versus the S&P500 (i.e. $SPX - black linear plot) with my thoughts:
And here's some recent chart action of the copper to Gold ratio, using the ETF proxies of GLD for Gold and JJC for copper (i.e. JJC:GLD) so that I can show part of today's action:
Because this is a ratio chart, it doesn't require the copper price to decline for the ratio to decline. It simply means Gold is likely to outperform copper, and this is not a sign of a healthy economy. Since I think the U.S. Dollar is in a topping pattern, copper could actually go higher or at least tread water while Gold explodes higher. This would be a sign of "unhealthy" inflation (i.e. not the "healthy" kind that makes many of the herd feel richer).
I remain long things precious and metal and wildly bullish on the intermediate and long term prospects for Gold and Gold miners, regardless of what the general stock market does. On a side note, those looking for fundamental data on miners should check out this new site: www.miningalmanac.com. It is free for now, though I doubt it will stay that way for long. My efforts to provide an updated junior Gold miner spreadsheet were short-lived, as I don't have the time or energy to keep it up to date. I have decided to just stick with the smaller cap Gold mining sector as a whole using the GDXJ ETF for most new long trades in the junior mining patch. I will leave it to others to discover "the next ten bagger," although I hope (wish? pray?) that they will post a comment or two when they find it...
Subscribe to:
Posts (Atom)