Wednesday, October 29, 2008

The swinging pendulum in history


GoldMoney. The best way to buy gold & silver
Below is a table I created to show a rough estimate of returns for gold stocks versus the Dow Jones Industrial Average during recent periods in history. These periods correspond roughly with long-term (i.e. secular) bull and bear markets in general stocks. Homestake Mining was a long-time blue chip gold miner that merged with Barrick Gold Corporation (ticker symbol ABX) in 2001 and serves as a reasonable proxy for the gold mining sector during the final 70 years of the last century.


These returns are somewhat idealized, as no one can pick the exact top and bottom for a long-term bull move. These returns also ignore dividends and inflation, which are NOT negligible when calculating long-term returns. But the basic concept is well illustrated: when the general stock market takes a dump for 10-15 years, gold stocks are a good place to be. Conversely, when times are good and general stocks are doing well, gold stocks are a crappy investment.

What about the 2000-2008 time period? Using the the ticker symbol GDX, which is an ETF (like a mutual fund) that represents a basket of gold mining companies (with a few silver miners thrown in), the idealized return from the low in 2000 to today's close is 320%. For the Dow, from the high in 2000 to today's close gives a return of -23%. Quite a difference, eh? Not only that, but we have just undergone a wicked correction in gold stocks, while the crash in general stocks is just a hint of what's to come.

From here on out, gold stocks are going to start significantly outperforming general stocks and dividends for gold stocks are going to start increasing rapidly over the next few years. Buy gold stocks now and hold for several years (but not forever!).
Buy gold online - quickly, safely and at low prices

Global trade collapse


The Baltic Dry Index tracks the price of shipping raw materials by sea. Because demand changes faster than the number of ships available to move cargo, it is used as a proxy for global demand for raw materials and is a leading economic indicator, meaning it can be looked to for its power to predict the health of the global economy over the coming months.

As a firm believer in the concept that price charts can tell better and more accurate stories than commentators can, let's take a look at a 6 year chart of the Baltic Dry Index chart:


This chart is saying that global commerce has come to a sudden, grinding halt. This is the real-world knock-on effect of the financial crisis. Everyone suspects everyone else is broke and no one wants to ship their goods to another country when they are concerned about whether or not they will get paid. Weaker countries are at risk of developing shortages of strategic goods and commodities if this keeps up.

How do central banks and politicians respond to such a crisis? By printing money and lowering interest rates to try to "grease" the wheels of commerce and get them turning again. This is why inflation will follow deflation like night follows day.

In a fiat currency world, you have to learn to jump from asset class to asset class or risk losing wealth due to currency depreciation. You can ill-afford significant losses when a 5% annual gain in paper wealth is needed just to keep up with inflation. When the stock market is in a nice, long-term secular bull market like in the period from 1982-2000, stocks will get you there and are the place to be. People who hold gold and gold mining stocks during these periods get KILLED.

When stocks enter a secular bull market correction (or secular bear market as its known to people who don't like bullshit and sugar coating on everything), such as the 1966-1982 period and the 2000-2008 period, people get KILLED by staying in general stocks with a "buy and hold forever" mentality. The current secular bear market won't end before 2015-2020, so there's plenty of time to get out of the general stock market and switch to what works. Gold and gold mining stocks are a good way to play this period and will perform just like regular stocks did from 1982-2000.

There are other proxies that can do well in these long bear market periods, such as cash when deflation is the primary problem or other commodities (e.g., oil, food) and commodity stocks when inflation is the primary problem. Because it can be confusing at times which force (deflation or inflation) will win out and tides can turn quickly (a la this summer when everyone thought oil was going to $200 and the dollar going to zero and now deflation is in full gear), gold and gold mining stocks are an easier way to play it than cash or general commodities.

By the way, when this secular bear market ends in a decade or so, I will be selling my gold and gold stocks and buying the S&P 500. I am not tied to any investment, I am a person looking to make money from my investments, whether it's real estate, stocks, bonds, oil, gold, or widgets. When an ounce of gold can just about buy the entire Dow Jones Industrial Average, I'll be looking to exit the gold trade and come back to CNBC to wallow in their ignorant financial cheerleading.

I think gold stocks have found a bottom, though they may have to re-test their lows to solidify a base to "launch" from. After that, it should be off to the races for a 50-100% gain in most gold stocks between this week and the end of May, 2009. Once spring comes, I'll be looking to exit gold stocks and go short the stock market again, though I will continue to accumulate physical gold as my safe cash equivalent that cannot be debased by the insidious actions of hopeless bureaucrats.

Tuesday, October 28, 2008

Why I am scared about the U.S. Dollar despite the current deflation


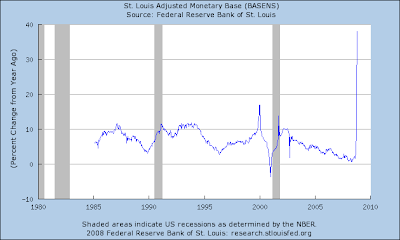
These two charts from the Federal Reserve website (http://research.stlouisfed.org/fred2/) show why. First, a chart of the nominal amount of "new money" created by the Federal Reserve lately, called the "Adjusted Monetary Base."


Next, to keep the nominal amounts in perspective, a chart that shows the percentage year-over-year change in the adjusted monetary base:


So, what does this mean? It means the Federal Reserve is printing money like mad. Right now, banks are hoarding the money instead of making new loans because banks are nervous to lend in this environment and consumers are either unable or unwilling to make major purchases right now (deflationary activities by these market participants). It is to the point where the Federal Reserve and U.S. Treasury are bypassing the banks and giving money directly to companies and shoring up commercial paper markets directly, trying anything and everything they can think of to ward off a deflationary spiral. Looking at the chart above, the monetary injections by the Fed after 9/11 and in anticipation of "Y2K" (anyone remember that crazy b.s.?) are tiny warm-ups compared to the current situation.

This monetary shitstorm is ultimately highly inflationary, though it will take time to work its way into the system. If everyone has $100 of Monopoly money and then the U.S. government hands out the equivalent of another $100 of Monopoly money per person, prices will double. That's inflation in an oversimplified nutshell. Cash is king during a deflationary period, which we are now in, but exactly how long it will last is difficult to predict precisely. Those who hold U.S. dollars during this period are doing the right thing, but they will need to switch back to other asset classes once this new money printing makes its way into society and the dollar begins to fall again.

This is why I hold physical gold. It will retain its purchasing power during the current deflationary environment (unlike other commodities such as oil) and it will rise in value once the next potentially massive inflationary wave gets underway. Gold does not require a healthy economy to perform as an asset and, in fact, tends to outperform (or at least hold its value) in times of economic trouble. For those who don't know anything about how to buy physical gold, it's time to learn.

Monday, October 27, 2008

Spin


It's everywhere. Two examples from the past 24 hours (though I know there are many more) are astounding to me.

First courtesy of marketwatch.com (http://www.marketwatch.com/news/story/g7-yen-warning-raises-intervention/story.aspx?guid=%7B11870235%2D4DBB%2D499A%2DBAA2%2D3063C0237881%7D), the headline:

G7 warns against 'excessive' yen volatility

LONDON (MarketWatch) -- A warning by the Group of Seven industrialized nations against "excessive volatility" in the Japanese yen Monday did little to quell safe-haven flows, but could set the stage for coordinated intervention aimed at arresting the currency's ongoing rise, strategists said.

''We are concerned about the recent excessive volatility in the exchange rate of the yen and its possible adverse implications for economic and financial stability,'' G-7 finance ministers and central bank chiefs said, in a joint statement. "We will continue to monitor markets closely, and cooperate as appropriate."


Below is a chart of the Japanese Yen with my comments:


Where is the "excessive" volatility relative to the historical price action shown in this chart? Japan wants to help "cooperate" (i.e. intervention by policy makers of different countries into supposedly free markets) to make its currency weaker, which will punish all its citizens who hold cash as a store of value or who are on fixed incomes.

Next up, home sales data compliments of Yahoo! Finance (http://biz.yahoo.com/ap/081027/economy.html):

AP
September new home sales rise by 2.7 percent

New home sales post unexpected increase as prices fall to lowest level in 4 years

WASHINGTON (AP) -- Sales of new homes recorded an unexpected increase in September as median home prices dropped to the lowest level in four years, the Commerce Department reported Monday.
Sales of new single-family homes rose by 2.7 percent last month to a seasonally adjusted annual rate of 464,000 homes, Commerce said. Economists had expected sales would drop from the August level…


After the headline and lead paragraphs, the following appears in this article: "The surprising increase in September sales still left them 33.1 percent below the level of a year ago as the country is battered by the worst slump in housing in decades."

Let's take a look at housing in chart form, shall we? The chart below is stolen from the Paper Economy real estate blog (http://paper-money.blogspot.com/), a great site.


Housing comparisons are ALWAYS done on a year-over-year comparison basis due to normal seasonal variation that makes adjacent month-to-month comparisons dubious at best. Yet, every month without fail since the housing crash has started, mainstream journalists report a little ray of sunshine by having a headline completely opposed to reality. The latest numbers are ATROCIOUS and downright scary! A 33% drop from the previous year is a devastating decline and indicates housing ain't even close to bottoming out.

What is my point with all this? Listening to mainstream media or our government for information about markets and trying to make investment decisions based on this information is the worst possible thing you can do. In fact, you're much better off assuming the exact OPPOSITE of what is printed or said to be true. George Orwell would be so proud of the "1984" society we have created.

If information is printed or stated again and again enough times, people start to believe it. It seeps into their subconscious and affects their decision-making processes. "Buy and hold for the long term" is a great example of false information and even the great Warren Buffet is about to learn that this isn't such a great idea all the time.

We have been on a fake, Monopoly money system for so long that people think it's safe and normal. Nothing could be further from the truth. The long-term chart of the Dow-to-gold ratio is telling us that we are headed for a long-term breakdown of trust in paper assets, which is clearly well underway but also has much further to go.

Gold is a SAFE place to park your money during this financial storm, gold miners are now (i.e. now that the correction in gold stocks has ended) the best way to profit in this ongoing storm that has much further to go, and no one in the mainstream media will tell you this until it is TOO LATE!

Gold is laughed at despite its 3000+ year history of serving as a currency and store of value and despite the fact that EVERY FIAT CURRENCY SYSTEM IN HISTORY HAS FAILED. Every single one, and believe me, there have been many. The current downturn in global stock markets and asset prices will not end until people wake up and repudiate the lack of a gold (or other hard asset) backing for their money. We are quite a ways off from this event. The world has been awash in paper Monopoly money backed by nothing but the hollow promises of politicians. We have had both the good (i.e. stocks and real estate go up) and the bad (gasoline and food go up) effects of the subsequent inflations due to excessive money printing.

Now we are in a deflationary storm that will resist all efforts to "print our way out of it," but the political hubris to try anyway will persist long after it is appropriate and create serious long-term damage to the fragile confidence in our system of paper promises. Gold will hold its value through this storm and the companies who dig the precious metal out of the ground will now outshine every other asset class for at least the next 2-3 years.

Sunday, October 26, 2008

Where we could be in the gold bull market


Markets often repeat in similar patterns and recognizing the past can often lead to an understanding of potential future outcomes, something that should always be of interest to investors and speculators.

When a hard correction occurs in a bull market, people's confidence gets shaken and they wonder if they made the right decision. This is the concept of "climbing a wall of worry" that makes skepticism a healthy symptom of a bull market. When everyone is convinced an investment is a no-brainer (remember the dot coms?) and will go up forever, the end of the bull is near.

Gold is in the midst of a bull market that saw its price rise from roughly $250/oz to $1000/oz before the current correction to $700/oz. Could it be the end of gold's bull market rather than just a correction? My opinion of course is that we're not even close. An example using charts may help put things in perspective.

Look at the two charts below, both part of historical bull markets. I have covered up the dates and names of the items being charted.


Both items went up over 300% then corrected roughly 30% or so. Somewhat similar, though there are clearly some differences. So what happens next? For the first chart, which is the Dow Jones from 1982 through the 1987 crash, this is what happened next:


So, when everyone was in a panic at the end of the 1987 crash, the smart thing to do would have been to buy even more at the temporary discount price and hold on for another decade or so. Because the long-term cyclical pendulum has swung in the direction of gold and away from stocks, the smart thing to do now is buy gold at the new discounted price and hold on for several more years (the second chart above by the way is the price of gold charted over the last 8 years or so). Once the price of an ounce of gold is almost equal to the headline price of the Dow Jones, everyone at work and on television will be saying that gold is going to $10,000/ounce and stocks are going to zero. At this point, calmly sell your gold and use the proceeds to buy stocks hand over fist.

However, we are not even close to this point yet. Gold is still considered a bizarre, outdated investment with no role in modern portfolios by a large percentage of investors. How many people do you encounter in your life who want to talk about buying gold bars and coins instead of their 401k when the subject of investing comes up? Big bull markets do not end until there is near universal participation. Gold went through a 20 year bear market from 1980-2000. It was overdue for a new bull market and one clearly started around 2001. The bear mentality towards gold persists in most mainstream circles despite a strong first leg of its new bull market. This is healthy, normal and indicates the end of the gold bull market is a long ways off from here.

Saturday, October 25, 2008

Homework assignment

Is to click on the link below, read the article it leads to, and think about the potential ramifications.

http://www.reuters.com/article/GCA-CreditCrisis/idUSTRE49N1XX20081024

To quote the Chinese STATE newspaper: "Asian and European countries should banish the U.S. dollar from their direct trade relations for a start, relying only on their own currencies."

Nice start. Wonder what comes after a start?

Being the reserve currency of the world has given the U.S. a huge advantage since WWII. Nixon broke our promise to the rest of the world when he stopped redeeming our dollar for gold in the early 1970s. Since we did this, we have been essentially relying on our charm, economic market stability and military strength to keep the charade going.

In the past several months, the global perception of our economic market stability has changed. Angry voices such as those put out by a STATE Chinese newspaper tell me our charm is wearing thin. And that last thing, the military strength, it requires the Chinese and Europeans (among others) to buy a lot of our bonds and use our dollar for transactions. If these two buyers aren't happy with us, they don't have to buy as many of our bonds and we run into a funding crunch that suspends the War on Iraq, the War on Afghanistan, the War on Terror, the possible War on Iran, and even the War on Drugs.

We'll be broke and overextended if currency "regime" changes like the one proposed above are implemented. These things, once started, can quickly become contagious. If all the "big money" around the world started to diversify out of this country, even a moderate amount, we could experience a serious currency crisis. This is what concerns me looking out at the big picture over the next decade.

I must hold gold due to my fear of this type of event. Cash is doing well right now - U.S. Dollars have been kicking ass. They've been the best bullish investment out there (though being a bull on being bearish and shorting the hell out of the market was the best strategy of all...). HOWEVER, the current currency game relies on cooperation. If cooperation fails, the U.S. stands to lose a lot.

If an "event" like this were to happen, there would be little or no time to prepare. If you woke up tomorrow and your currency had been devalued by 30-50% while you slept, what then? Gold protects against these types of events. That's why it's good portfolio insurance. Gold will be around longer than all the currencies now floating around the world. Think about all the global currency changes just during the last century. The Euro, a household name and a leading world currency, has been around only since 2002! Gold has been used as money for thousands of years, not less than a decade. Every fiat currency in history has failed. PERIOD. Gold may change in price, but hasn't failed in its long term role of maintaining purchasing power like fiat money has.

I don't deny that gold's shorter term twists and turns, like say the very brief (ha, ha) period from 1980 to 2001, can make it a poor investment at times. That's why I like the Dow to gold ratio, as I plan to switch back to regular stocks once they become undervalued relative to gold. Until then, gold and gold stocks are the apple of my eye.

Those who defied the government and kept gold after it was outlawed during the "First Great Depression" made out well relative to holding cash. That's the problem with cash in a fiat system. It fails to hold its value over time, which is one of the functions money is supposed to perform. If your family amassed 10,000 US dollars in 1929 and you kept them under your mattress and still had them, you'd have money for an exotic vacation or enough to buy part of a car. If someone gave you 10,000 US worth of gold in 1929, given that it sold for a little over $20/ounce, you would have received about 484 ounces of gold. At a current price of $700/ounce, you'd have over $338 thousand worth of gold (and gold's bull market ain't over yet).

Even if the U.S. dollar remains strong relative to other fiat currencies, they are ultimately all caught in a strong long-term bear market of depreciation. Gold isn't subject to depreciation in the same manner as fiat currency. Whether gold is hated, loved, laughed at, worshipped, ignored, buried in the ground or worn around an extremity, it retains value over long periods of time. The same cannot and should not be said about the US dollar or any other fiat currency.

Party like it's 1981 - Japan style!

The Japanese stock market got hammered this week like every global stock market. The long-term chart for the Japanese Nikkei stock market average is both compelling and instructive. Take a look:


This market is now back at levels seen in 1981. In other words, after 27 years, Japanese stocks in aggregate have made no net progress. If you factor in inflation and the offsetting effect of stock dividends, we're talking 27 years and zero net return. TWENTY SEVEN YEARS IN AN INVESTMENT AND NOT ONE DIME OF PROFIT.

Japan is a modern, advanced economy and they have a well-educated populace with similar age-related demographics. They do not have the same bounty of natural resources that we do, but they have an advanced physical infrastructure and a dedicated workforce. Their stock market lost 80% of its value between 1990 and 2003. No country, not even the good 'ol US of A, is immune from cycles and corrections.

Our stock market peaked in real terms in 2000 and has been mired in a secular (i.e. measured in decades, not years) bear market that will last until at least the year 2015. Possible targets are easy to guess at, but only a range can be provided with a best and worst case scenario:


Stay out of the general stock market, hold cash, buy gold, and invest in gold mining stocks. Traders can alter between shorting the stock market and riding the brief and wild bear market rallies. The nasty part of this stock market bear has already started, and though it is about to take well-deserved rest, the bear will awaken again in a few months to terrorize "the buy and hold forever" crowd. McCain, Obama, Paulson, Bernanke and anyone else with a slogan or plan to sell the sheep will only make things worse.

Remain calm, all is well.

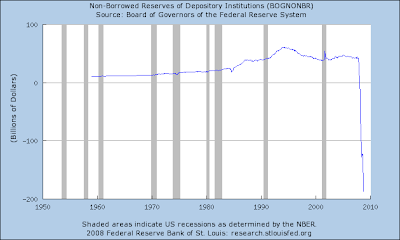
Below is a VERY SCARY chart from the Federal Reserve's website that has just been updated, which plots the "non-borrowed reserves of depository institutions" or in oversimplified English: "how much actual money banks have available to return to the people with bank accounts."


Now remember, the Federal Reserve is a private, for profit corporation with a no-bid government "contract" to print our money. At this point, the Fed has agreed to accept not just U.S. Treasuries as collateral from other banks, but dodgy, sketchy commercial paper that cannot be sold for more than 10-40 cents on the dollar. By the way, this dodgy collateral is losing value by the day as home values continue to plunge and people are scared to invest in these exotic instruments of mass financial destruction. How will the banks pay all the money they borrowed back to the Fed? What will the Fed do when this dodgy collateral loses even more value while it is still on their balance sheet?

I'm not saying banks are a lousy investment right now (although they are), I'm saying that banks are bankrupt and have no money. They took all the money we "gave" them in the form of deposits, leveraged up to the hilt in a rampant gambling scheme, and lost all of our money. The Fed is trying to bail them out, but make no mistake about it, the Fed will not risk their entire franchise to save all the banks.

So, when the banks continue to fall like dominoes, the FDIC will step in and guarantee all the deposits. But where will the FDIC get the money? Perhaps another bailout package?

Perhaps anyone making over 100 dollars a year should donate it all to the government and the FDIC. It would be patriotic as hell! Then, the government can give the citizen-donated money to the banks and the banks can loan the money back to us at a low, low interest rate (but hurry, this special rate won't last!). Of course, the congressional bill to accomplish this will require that 20-30% of the donated money must be used to bribe the congress to pass the bill they wrote, so we won't be able to get all the money lent back to us after we donate it. Such is the cost of freedom, but dammit we're American and we're the greatest!

I'm not trying to slam just America, because this is a global monetary system gone mad. How can almost everyone in the world accept that money can be printed into thin air, backed by nothing, and that this can lead to a stable system? The boom and bust swings are getting wilder, not tamer, since we gave the Federal Reserve the keys to our monetary kingdom. Bust dead ahead and it will be vicious, violent, and unprecedented. Remember, the Great Depression was not an event, but a long, drawn out process.

People who think gold bugs are crazy need to look in the mirror. A gold standard for money is a leash on unchecked government power and unchecked government spending. The leash is broken and a big, rabid government dog is on the loose and hungry for blood (and our wallets). If gold is a stupid investment, why does our government (and every other major government in the world) hold and own so much of it? Do what we say, not what we do? Why did the U.S. government make personal/private gold ownership illegal for 40 or so years? Is gold really that dangerous and, if so, why?

Bottom line: common sense is gone and the stock market is going to follow it into oblivion before we can have a meaningful recovery. If you haven't done so already, use the coming stock market rally to get out of general stock market investments (all stocks other than gold stocks). I prefer a heavier allocation to gold than cash (though I hold both), because the system backing our cash is much more fragile than anyone holding the reigns of power (or campaigning for office) knows and/or cares to admit.

Friday, October 24, 2008

BUY, BUY, BUY!

Buy Gold stocks for profit, buy physical Gold for safety and hard cash that can't evaporate. The time is now. Buy, buy, buy!

The lows are either going to be in today or by the end of next week at the latest for Gold stocks. Gold may take a little longer, but it is still a good deal (if you can find any). The coming long term cyclical Gold bull in stocks will last 2-3 years and will create gains of 200-300% at a minimum while the rest of the market burns. If your 401k or 403b or IRA or Roth IRA won't let you buy Gold stocks, either take your money out and don't participate any more or stay in short-term US Federal government bond instruments (5 years to maturity and less).

General stocks (i.e. S&P 500, Dow) are bottoming over the next week and will rally for at least a few months, but then they are going down again - hard! Gold stocks are bottoming over the next week and then they are going to take off like a rocket ship and start a new bull market that will last years.

Buy, buy, BUY! BUY! BUY!

Wednesday, October 22, 2008

More bliss, more buying...

Gold stocks went on sale again today so I bought some more. I intend to have 95-100% of all my "stock market investment money" invested in gold stocks by Halloween. I also have cash, gold and silver that is outside the system as my safe "cash equivalent" holdings.

Today I bought Yamana Gold (AUY) call options and put in orders to buy Newmont Mining (NEM) and Royal Gold (RGLD) call options. I wanted to buy some more physical gold, too, but I don't have any extra money right now.

I am feeling wildly bullish on gold stocks despite the beating they have taken lately, as it clears the deck for a spectacular 2-3 year bull market in gold stocks that should be one for the record books, especially compared to the beating the general stock markets are going to take over the next 2-3 years.

Remember: the price of one ounce of gold will equal the price of the entire Dow Jones Industrial average at some point in the next 10 years and stocks will be a terrible long-term investment until this occurs. The Dow to gold ratio closed at 12.4 today (near resistance), and the chart says that this ratio is getting ready to take a fresh plunge that should begin within the next 2 weeks.

Tuesday, October 21, 2008

Still not convinced you need some gold?

I have been feeling paranoid and a little scared lately because of the speed at which recent global events have unfolded. Argentina is apparently in another crisis and is moving to seize private pension funds (see http://bloomberg.com/apps/news?pid=20601087&sid=aDuA9V2SI6GY&refer=home) and Iceland just had a financial collapse!

I want to look at the Iceland case specifically. Basically, Iceland owed too much money, then tried to nationalize their 3 major banks but the massive debts incurred by those banks exceeded the government's ability to cover the debts. If you want to be scared shitless and realize the importance of protecting your assets, just have a look at the potential parallels between Iceland and the United States.

First, a chart of the Iceland stock market (copied from the Wikipedia website):


That's a 90% loss in about a year and it's actually much worse because a currency crisis happened at the same time, which means massive inflation, so inflation-adjusted losses were close to 100% for Icelandic citizens invested in their local stock market.

How could this happen? I don't pretend to understand all the fine points of such a rapid collapse, but some crude figures frame the issue in fairly easy to understand terms. A large part of the problem was that the Iceland economy had a gross domestic product (GDP) of roughly 11 billion dollars (i.e. crudely, how much money they earn every year or their annual "income"). The Icelandic banks got into trouble with cash flows due to difficulty in rolling over/renewing short-term debt due to the credit crunch and their problems were compounded by a run on the banks by nervous (and smart) depositors.

The Icelandic government moved in to nationalize the banks, which increased the government's debt to roughly 65 billion dollars, or nearly six times the annual economic output (i.e. "income") of the country. Though a gross oversimplification to help me understand things in basic terms, the heart of the problem was too high of a debt load relative to income (sounds like a subprime or Alt-A mortgage borrower, eh?).

The United States has a gross domestic product of roughly 14-15 trillion dollars per year, much greater than Iceland, and our gross external debt was roughly 14 trillion as of June, 2008 according to Wikipedia. Our three largest banks are JP Morgan Chase, Citibank, and Bank of America. Combined, these three banks are currently holding approximately 165 trillion dollars in derivatives contracts (see page 22 of the document at http://www.occ.treas.gov/ftp/release/2008-74a.pdf for the source of this data). If we end up having to do a full bailout and nationalization of these banks, a process we have already started, our ratio of debt to GDP could be very similar to the ratio that just caused Iceland to collapse a few short weeks ago!

How do our politicians respond? By wanting to send more "stimulus" checks to anxious voters using more money we don't have and creating more debt and wanting to nationalize even more than the top 3 banks (9 largest banks at last count and the auto industry and AIG thrown into the mix just for shits and giggles). Meanwhile, U.S. citizens have very little savings in aggregate and many have learned from their government how to get in debt far beyond their ability to pay.

If you think we can't go through the same thing Iceland just did, you are fooling yourself. Not only could your investments be wiped out, your bank suddenly closed, all your money frozen, and your credit cards no longer functional, but the cash you have on hand could be rapidly depreciated away so that $50 will barely buy a loaf of bread. This has happened many times throughout history and Iceland is just the latest in a long line of examples.

What could possibly protect you in this situation? GOLD! That is why gold is an investment as well as an insurance policy. When a currency collapses, the gold price in that currency approaches infinity.

So, when you hear about the next bailout plan, the next new alphabet soup Federal Reserve lending plan, or the next stimulus package, ask yourself this basic question: How can someone who is up to their eyeballs in debt with the equivalent of 10 maxed out credit cards and an underwater mortgage loan give loans and free money out to anyone and everyone? If something fails the common sense test, maybe it's not your common sense that is at fault.

Also, do you think the citizens of Iceland were warned by their politicians in advance of the crisis so that they could prepare themselves? Which members of the Icelandic mainstream media do you think told citizens to take their money out of the stock market and out of their bank in advance of the collapse?

Do you think the government or the mainstream media will warn you in advance before the same thing happens here in the United States? Do you really believe it can't happen here? Do you think we're better than everyone else? Do you think that the U.S. can ignore a basic law of finance related to how much debt an entity can take on relative to income before that entity is unable to make good on its obligations?

Gold is money. Gold is good. Gold is insurance. Gold cannot be debased by politicians with a printing press. Gold has intrinsic value and has served as a store of wealth for thousands of years. Gold will significantly outperform the stock market for the next several years. Get some physical gold (and a little silver) and hold onto it.

Gold versus the US Dollar

We're getting very close to a trend change in the US dollar and gold. As I write this, the U.S. Dollar is up to near the 86 level from the 71 level in March. This is a gain of roughly 21% for being in cash over the past 7 months (not to mention the potential further gain by being out of stocks recently)! Cash has clearly been king over the past 7 months and the U.S. dollar has been the best and safest place to be for the average investor.

Meanwhile, the investment near and dear to my heart (gold) has been taking it on the chin since March, falling from a high of $1030/oz. to near $750/oz. now, a loss approaching 30%.

However, the tide she is about to turn. Take a look at the chart below, which overlays the U.S. Dollar index chart (red and black squiggles) and the price of gold (black line) between 2004 and today's closing prices.


I believe we're at a similar juncture in time as July, 2005 in terms of what comes next for the US dollar and gold price. At that time, the U.S. dollar was finishing its second-to-last price leg up and gold was just finishing its correction. A few weeks later, the dollar was going down and gold was going up. In fact, gold at this time went up from $425/oz to $725/oz in less than a year, a gain of 70%.

The bottom line is that it's a great time to trade some of your stocks or extra cash for physical gold. Insurance is rarely so cheap and buying physical gold as an insurance policy can also pay a dividend of price appreciation and be passed on for generations.

Also, for those who think the gold price is simply the inverse of the US dollar, I ask you to re-review the chart above during the time period between March, 2005 and March, 2006 when both investments went up in price together.

Repeat after me: stocks and real estate going DOWN, gold and cash going UP. The price of one ounce of gold will equal the price of the entire Dow Jones Industrial Average at some point within the next 10 years and stocks will be a LOUSY investment until this occurs.

Monday, October 20, 2008

Inflation versus deflation - who cares?

Well, anyone who cares about investing should, but other than that, everyone who exists on the planet and isn't wealthy beyond belief should! Basic example: cash is king during a deflation but cash is trash during a significant inflation. In other words, cash is essentially the best investment during a deflation if one is not interested in or able to bet on price declines in the stock market, commodities or real estate. On the other hand, cash is the worst possible investment during a heavy inflationary period, because the value of money declines in such an environment.

The current period is characterized by an intellectual battle between smart investment advisors who favor inflation and those who favor deflation. Those commentators who are not smart, are seen on mainstream television and radio, and who don't know their ass from a hole in the ground have a unanimous opinion: who cares - just buy stocks and then buy some more! These same people told you to buy stocks in 1999, 2000, 2001, 2002, 2007 and 2008. Even a broken clock is right twice a day, but some of us are seeking to do better than the sheeple.

On the one hand, banks are in trouble, a recession is well underway, unemployment is rising, real estate prices are declining, and people are up to their eyeballs in debt. These are deflationary forces. The unwinding of a debt bubble is essentially always deflationary.

On the other hand, our government is handing out money to banks and other asshats as fast as they can run the printing presses and is now talking about a second stimulus package.

Here is the key to understanding where we are heading: GOVERNMENT IS A PARASITE ON THE ECONOMY. IT CAN "TWEAK" THE PRIMARY TREND SO IT MOVES FASTER OR SLOWER AND SOMETIMES STEER HOT MONEY FLOWS INTO A PARTICULAR INDUSTRY, BUT GOVERNMENT CAN NEVER, NEVER, NEVER CREATE THE PRIMARY TREND OF THE BUSINESS CYCLE. If you understand this, then you understand that deflation is king for the near-term future.

Now, having said this, those trying to time the markets as to deflation versus inflation may have a tough job. What I mean by this is that it can be dangerous to underestimate the incompetence of bureaucrats. We could have a deflation that is aggressively fought by our fearless leaders with massive money creation. The issue then is that we could lurch from a deflation to a severe, intense inflation, possibly even a hyperinflation, and the transition could happen within a few months' time if our creditors really start getting nervous and decrease or cancel our lines of credit.

The solution? Buy gold. Gold will hold up OK during a deflation; will increase in value relative to food, oil, stocks, real estate and almost every other asset (except possibly cash); and will not require a rapid investment theme switch if we move from deflation to inflation because gold will kick cash's ass if we lurch into a currency crisis/heavy inflation. Gold is "asset protection" insurance and should comprise at least 10-20% of your portfolio in the current environment.

By the way, the "Goldilocks" scenario of "no inflation or deflation, just a muddle through and stocks should do OK" is a fantasy created by those who wish to avoid reality and bury their heads in the sand. It won't happen.

Though stocks will do poorly in either a deflationary or heavy inflationary environment, they tend to do better in an inflationary environment. Gold stocks outperform gold during a deflation and the reverse is true during a heavy inflation.

Deflation is king for now and I would advise heavy purchasing of gold stocks over the next 2-3 weeks, with a reasonable goal of at least a 40-50% gain over the next 6 months. Buy the gold stock ETF (ticker: GDX) if you are not familiar with the sector. Plan on selling and locking in profits between mid-April and mid-May if you are a trader and plan on holding for at least 2-3 years for a 200-400% gain if you are an investor.

Saturday, October 18, 2008

Fractals and gold correction

A lot of people invested in or thinking about investing in gold have been spooked by gold's recent performance, which has been relatively erratic. This is the nature of market corrections. They shake out weak hands/investors and create fear so that the next new bull leg can begin.

Take a look at these two charts below, ignoring the dates and price levels and focusing on the shape of the chart pattern.


The top chart is a gold correction in 2004 and the bottom chart is the ongoing 2008 gold correction. Now you know the concept of fractals, or patterned fragments that can sometimes give clues as to what comes next. To put things in perspective, here is a long-term gold price chart using a log-scale. The two corrections shown in the charts above are circled on the chart below.


Will these patterns result in the same post-correction outcome? I don't know for sure. What I do know is that we are in the middle of a healthy bull market correction in gold that sets the stage for a new all time high in the gold price. We could correct for another year or start taking off next month, but corrections are a great time to buy for investors, as they are breaks in the price action that allow you to buy low so you can sell high later.

The gold price fluctuates just like the price of all assets that are traded. However, make no mistake about it - gold is in a long-term bull market and stocks and real estate are in a long-term bear market. Gold going up, stocks and real estate going down. Once the price of one ounce of gold is about the same as the price of the Dow Jones Industrial index, I will sell most of my gold and buy stocks and some real estate. Until then, buy gold or stay in cash as a longer-term investment strategy and stay the hell out of the stock market.

Thursday, October 16, 2008

There's blood in the streets...

Today was my dream day. Gold stocks went on deep discount and so I waded into the bloodbath today and picked up options on gold stocks for cheap. Heavy purchasing of calls on Goldcorp [GG] and Royal Gold [RGLD] today (my overly greedy/miserly Yamana Gold [AUY] offer didn't fill). Was today the bottom? I don't know. We could go lower. However, I think we are VERY close to the bottom and you get to a certain point where trying to time THE exact bottom is not worth the effort. Nobody is that good with any consistency.

I just want to get the meat of this coming gold stock rally, which should be good for 50-100% gain on the actual stocks and 200% or more for the options. I've still got a little powder dry in case I need to double down, but I'm feeling really good about an entry point today near the lows. We should bottom out for sure before the month is over and the rally in gold stocks should last until at least mid-April. Though this next intermediate rally probably won't be the biggest leg of the coming cyclical gold stock bull phase, which is within the context of a secular gold bull market, it should still be profitable and easy to make money on.

Like my Gina says: "IT'S TIME TO SHUT IT DOWN." I'm hunting for profits amid the carnage, knowing Rome is burning around us.

Tuesday, October 14, 2008

Waiting for the paint to dry...

A very mature bull market in long-term U.S. Treasury Bonds exists. While deflation reigns, this bull market is unlikely to significantly break down. However, if this chart of long term U.S. 30 year bond prices ($USB) makes a significant turn downward, that means inflation is about to rear its ugly head.


When bond prices go down, the percent yield goes up. When the bond market is anticipating future inflation, it wants higher yields to compensate for the anticipated loss of purchasing power inflation causes. During a deflation, yields on the highest quality federal government bonds will remain low.

Waiting for this chart to break down is like watching paint dry - BORING. This is a monthly chart that starts in 1980. However, one would be remiss to look for capital gains from bond price appreciation after looking at this chart, which is in the very gradual process of topping out, and the yields and potential risk to the down side make a current investment in these instruments a poor choice.

I will stick to the deflation trade until this chart significantly breaks down (a monthly close in price below 90 on this chart oughta do it). This could be a decade away for all I know at the rate this chart is moving. Yields on 90 day short term U.S. government paper (i.e. T-bills) have essentially touched ZERO a few times in the past month! As a frame of reference, T-bill yields were close to 20% during the early 1980s.

Monday, October 13, 2008

Bear market up days

The general markets were up 10-11% today - a whole year's gain in one day! This is a hallmark of bear markets. However, volume was weak and so was breadth. We may get another 1-2 day rally out of this, but I think we'll head right back down for the bottom and we could even get a reversal tomorrow by the end of the day. We're not at the bottom yet for this leg and I think gold stocks will fall a little more, too. Patience is key.

Bear markets are all about volatility, which means wild fluctuations. Traders love bear markets, because if they guess right, they can make a lot of money fast. Don't be fooled into thinking that government bailouts are going to change things. Specifically, the government cannot save the economy.

Unemployment will continue to increase as fast as government promises do. Housing will continue to sink, even if the government starts to buy up houses. Banks will continue to hemorrhage money even if the government doesn't allow them to fail. These things guarantee a horrible recession and potential (probable?) depression. I am not a gloom and doomer, I am a realist. The more government interferes and prevents the people who screwed up from failing, the longer and more painful the recession will be. The government didn't stop the Depression, but they did manage to deepen and prolong it.

For God's sake, we NEED a recession. We need to clean out the rampant excess and greed that plagues our country. The bull market from 1982-2000 was the greatest in the country's history and there needs to be a correspondingly severe bear market to correct the excesses and over-the-top speculation. That's the way cycles work. It's not a bad thing if you're prepared for it!

If you know stocks are a shitty investment until at least 2015, then you can just invest in something else or stay out of the markets completely. Why we aren't taught that in school (I got an MBA, and believe me, they didn't mention it in any of my classes) is beyond me.

Saturday, October 11, 2008

Physical gold and silver versus paper

I know this guy who buys physical gold and silver as a form of portfolio insurance and to profit from the bull market in precious metals (which is not over yet). This friend has noticed recently the disconnect between the quoted "price" of gold or silver and the price at which it is easy to actually buy physical metal. No bullshiite, many coin dealers are sold out of silver and/or gold bars and common coins and have been for weeks (and months in some cases). Why would an extremely steep drop off in price cause people to wet themselves and bum rush the nearest coin shop to buy precious metals? What wackos want to hoard a barbarous relic?

Did you know the U.S. Mint ceased minting gold coins (American Eagles first, then American Buffalos, some of the most popular ways to invest in physical gold for U.S. citizens) because of high demand? I've read Orwell. I know, right makes left and up makes down. Let me get this straight. Our government is broke. We borrow money from Asia, the Middle East, and anyone else with a pulse and a checkbook; but God forbid, we keep up with demand for our minted coins and make some of our own money to help pay some of the bills.

No, if demand increases for our coins, we'll simply announce that we will no longer produce the items that people want, no matter what. We won't just get behind and delay shipments of our coin due to increased demand, and we won't just fulfill the order as soon as we can so please be patient while we catch up, we'll just COMPLETELY STOP MAKING THESE COINS BECAUSE PEOPLE WANT THEM. We don't want people to want these coins, for God's sake! No, we make them so people won't like them or buy them and we don't want them to be a success. In fact, we have stopped making these coins indefinitely with no explanation other than “heavy demand.”

People, please think with me for a minute and just stop drinking the Kool-Aid for 2.53 seconds. Do you think our government stopped making gold American Eagle coins because they have your best interests at heart? I mean God forbid the government actually try to please its customers, whether it be via minting gold coins or voting AGAINST a banksta bailout. The physical market has disconnected from the paper market because trust is breaking down. This is part of the nasty bear/social mood cycle down we are in and is part of the reason to be bullish on precious metals, at least as portfolio insurance if nothing else.

Bad money (fiat U.S. dollars) is chasing good money (gold and silver) out of the system. That can only mean one of two things: there are too many paper dollars chasing things of real value and/or the things we used to think were valuable are no longer valued.

Because decreasing land, commodity and stock prices are deflationary and deflation can never be tolerated, inflationary medicine is being poured over our economy liberally. This inflationary government medicine is also know by its street name: "printing money out of thin air." What a treat! Can you imagine being given the privilege to order that money be printed out of thin air? That sounds like a habit I could get used to. The economy is slow? Sprinkle some fairy dust on it and it'll perk up - duh!

The market is in deflation but the government is trying to change it. Markets will win (as always) but governments will push their inflationary medicine so hard that once the markets are done dealing with their deflationary issues (1-3 years?), the United States (and others that seem all too willing to follow our lead lately) could lurch into a highly inflationary drunken fit. Buying gold now gets you in at a reasonable price and ensures protection from the monetary storms that lie dead ahead.

I have seen premiums AT MULTIPLE DEALERS for physical metal products I like ranging from 10-100% over the paper market spot price lately. This compares with 5% or less for the previous five years. Things changed last spring, possibly for awhile. I understood when dealers had sketchy inventory after we cracked $1000/oz gold and $20/oz silver last spring. I mean yo, the fever was on and the bull was raging. Intoxicating gains make a speculative beast tough to tame. But when gold dropped from just over $1000/oz to $750/oz, the shortage remained. Now, the U.S. Mint is too busy to supply customers willing to pay 25% over spot price for their coins. Forget the fact that it is one of the U.S. Mint's mandates to do so.

I bought lots of physical silver at $15-18/oz, not exactly near the bottom. I believe we're going into a brief deflationary period and I know silver doesn't do well in a deflation. The "paper" price of silver is now at $10/oz (i.e. futures price or price seen on a kitco.com price chart). Not a great investment so far, eh? Yet, on Ebay and at multiple dealers in cyberspace and/or a town near you, physical silver in the "real" market sells for $15-22/oz.

You see, actions can have unintended consequences. When bad money is used to chase out and beat down good money, the good money goes into hiding. And it becomes demanded by more and more people who lose faith and trust in the paper promises. It has happened with every fiat currency in history. A worldwide experiment of giving one country the ability to print the reserve currency for the whole planet at its whim is headed toward the same fate. The current fiat currency regime (nightmare?) may be the grandest in terms of scale, but this scheme like all others before it is destined to fail and flame out at horrible economic and societal cost. This is not a conspiracy, this is the expression of human character flaws. Few mortals can resist the temptation to print more money in a time of need once they have had their first taste.

Gold is an alternate currency. It competes with the paper promises of panicked politicians, which throughout history have yielded less than a junk bond and harbored three times the risk. Which investment do you think will hold up better going forward?

Why I'm looking for a bounce and why it's just that

Markets do not travel in straight lines. There is a daily clash between buyers and sellers. Some believe things are going to get better and some believe they will get worse. It is impractical to always be a bull or bear. Investing is about making money, not blindly always cheering for the same directional outcome. Being a bull in the stock market from 1982 through 2000 was a great idea. Since then, not so good.

During the wicked stock market bear market from 1929 thru 1932, the Dow Jones lost 89% of its value. That's right, 89%. If you lose 89% of your investment, you will then need to make over a 900% gain just to get back to even. Translation: don't "suffer" through bear markets because Suze Orman or Ben Stein told you to invest "for the long haul."


This chart below is courtesy (no permission obtained) of http://www.technicalanalysisbook.com/, via the http://www.financialarmageddon.com/ website.


Though the big picture is clear - this is the chart of a bear market over 3 years that wiped out 89% of investors' capital - the short term swings are wild and each contains a year's worth of gains! Bear markets are great for traders because of the wild swings in both directions. Stated another way, bear markets are more volatile than bull markets. In fact, some of the greatest positive gains in daily and weekly percentages are during bear markets, not bull markets. When you see multiple days in a short period of time that show 3-5% gains for the general stock market averages, you are paradoxically much more likely to be in a bear market than a bull.

For those not interested in the day to day drama, moving to cash at the top of the 1929 market meant that you could have bought NINE TIMES the number of stocks just 3 years later by staying out of the market. Additionally, the number of companies that had gone out of business by the end of this wicked bear market meant that the companies left standing were lean, mean, money making machines with a high dividend yield. This leads to wealth creation and this is why staying in cash during a bear market is a great passive strategy. But you have to pay attention to see the bear markets coming. In other words, did Cramer and/or the jag-offs on CNBC warn you a year ago that a bear market was coming and you should sell all your stocks?

Me, I'll stick with attempting to trade the intermediate bear market swings to magnify gains. That's why I'm getting ready to buy gold miners hand over fist, since I anticipate a wicked rally in this sector that will outpace the upcoming general stock market rally. A week ago? I was shorting the market. Now, I'm a bull. I will continue to labor to be neither an uber-bear nor a bulltard, but rather a shrewd investor.

Cash and gold - 1 year returns

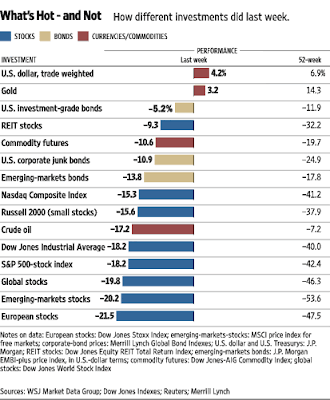
Below stolen from the Wall Street journal, via The Big Picture blog.


Gold has outperformed cash over the past year and both have trounced stocks and real estate. This trend will be intact next year as well, but I suspect gold will pull even further ahead of cash. Gold cannot go bankrupt and has been real money for 5000 years, while hundreds of man-made currencies have come and gone. The U.S. dollar will be just a memory at some point, but gold will still have intrinsic value for years after this occurs. Gold can be passed on to children and grandchildren and will always retain its value, while companies come and go (ask ex-Bear Stearns and Enron employees). Gold is the protector of the common man.

If you do not have any gold as part of your investment portfolio, you are ignoring the wisdom of centuries of accumulated knowledge. Most who know what they are talking about recommend 5-15% of your net worth/investments be in gold/precious metals. Though silver has more explosive and volatile potential than gold and can provide outsized returns, it doesn't do well during deflation and is not for the faint of heart (gold is volatile enough).

The Dow to gold ratio closed around 10 for the week and we will get to a 1:1 ratio before this secular bear market finishes. I don't know if that will be at Dow 1,000 or Dow 10,000, but either way, gold will kick the Dow's (and S&P 500's and Nasdaq's) butt for at LEAST 3 more years. Once the ratio returns to 1:1, you can sell your gold and buy stocks "for the long run" and you'll be able to buy a whole lot more stocks than everyone else around you.

I recommend PHYSICAL gold coins and/or bars kept in a safe place where there is no risk of default and do not trust GLD (an ETF that tracks the price of gold) to hold up when the poop really hits the fan. I like Krugerrand 1 oz. gold coins (minted by the South African government) for their recognizability, liquidity and small unit size that allows incremental purchases when funds become available.

Friday, October 10, 2008

Gold miner fundamentals ripe for investing

A few charts to show how good fundamentals are for gold miners. We are within 15-20% of the final low for this gold miner stock correction, which has been wicked in terms of percentage and how fast it has been. The gold mining sector is nothing if not volatile. However, the next leg up will be just as if not more powerful than this current leg down.

First, a gold to $XAU ratio chart, which divides the price of an ounce of gold by the price of a blue chip gold mining index ($XAU). When the ratio is high, gold is favored over mining stocks.


This ratio chart shows a current "blow-off" top with an exhaustion gap that should be quickly reversed. Notice the last time this happened in mid-1986. This means we are within a few weeks of the low for gold stocks.


This long-term chart of the $XAU shows what happened in the year after mid-1986, the last time there was a blow-off top in the ratio - a gain of roughly 265% in one year. Not only that, but I am looking at buying stocks that will make more in percentage terms than the $XAU for this next leg up and I am going to buy options (translation: 300-600% gains are possible). If you look at other peaks in the ratio chart through the past two decades, you can see evidence of 100-150% gains following these peaks routinely.


What supports this happening again? Many things. First, people are scared of financial things and are moving toward tangible things that can't evaporate (like 401k plans invested in equity mutual funds). Second, the "real" price of gold is skyrocketing. The concept of the real price of gold is critical to understanding the profitability of mining companies.

Remember that gold miners dig both a commodity and money out of the ground. In a deflationary bear market environment, the commodity function of gold is less important than its monetary role. Cash is king during deflation, because the price of everything else you would want to invest in is going down (real estate, stocks, corporate bonds, unstable government's bonds and all other commodities). In other words, the true price of what the gold miners are digging out of the ground is increasing relative to what it costs to dig it out of the ground. Profitability for miners expands rapidly in such an environment. The best way to display the real price of gold is to compare it to other tangible goods, such as energy (which is a major mining expense).

The gold to general commodities ($CCI as a proxy) ratio chart shows the increased profitability that gold miners are now experiencing.


Bottom line: we are near the psychological (i.e. technical) bottom of this leg and the underpinning profitability environment (i.e. fundamentals) is strong. Within 2-3 weeks gold stocks should bottom and I will start to make some serious money in the gold stocks. I nibbled on a small amount of RGLD and GG today and will starting buying much more on significant price dips over the next 2-3 weeks.

Thursday, October 9, 2008

Out of shorts

I sold all my puts today ten minutes before the close near the lows for the day. I am not sure that we are done falling, but we are getting close enough where the obscene profits I made were too good to pass up. I am now all in cash and physical gold.

The next play is a no brainer. I will be BUYING GOLD MINERS. I'm going to start looking for bargains tomorrow if we have a panic in the morning. I am not going to buy all at once, but rather I will average in over several days. I am particularly interested in Goldcorp (GG), Royal Gold (RGLD) and Yamana Gold (AUY) and will be buying 2010 LEAP options with a strike price 30-40% above the stock price at the time I buy. Trust me, it's going to be a worthwhile ride. Worst case scenario will be 50% gain in the underlying stock and with options, we can expect 100-150% gains at a minimum.

We are in the midst of a wicked deflationary bear market and are set to embark on a "recovery" bounce in the general markets that will begin within the next month and last until spring. I plan to ride the gold stocks up into the spring, which will outperform other sectors during the bounce, then cash out and start AGGRESSIVELY shorting the market again in the spring. If you are a traditional buy and hold investor or stock market bull, don't forget this leg down that is almost done. Burn it into your brain. Remember how it made you feel. This winter and spring, when the market makes a bounce recovery, you might start (erroneously) thinking that you should keep holding. You will be wrong. If you continue to hold through next summer you will have more of your portfolio wiped out and it will take a decade or two to recover that money.

Next spring, after the intermediate term bear market rally is over, we will have another DEVASTATING decline in the general markets. I recommend anyone spending their valuable time reading this buy some physical gold coins to keep in their possession as a long term safety play (and a great investment) and some physical cash in their possession to cover at least one month's worth of expenses. Do not think a bank "holiday" can't happen here in the good 'ol U S of A.

Stock markets "see" the future and clearly, what they see ain't pretty. This is not a "temporary, irrational selling spree," though the rapidity and steepness certainly classify it as a "panic" move. However, this is rational panic, NOT irrational panic.

We all need to take off the rose-colored glasses and learn how to protect ourselves and our loved ones from this mess. I promise you, you can't do that by spending your time figuring out whether you want to vote for McCain or Obama - they're both clueless and have no idea what to do. After studying markets, market history and cycles religiously for the past few years, I think I may be able to help mitigate the pain that we are all going to start feeling from the fallout that has unfortunately just started.

Tuesday, October 7, 2008

The yield curve

The yield curve can give a general signal about whether times are good or bad, much like the Dow to Gold ratio. Without getting into too much economic mumbo jumbo detail, a general assessment of the stock market "weather" can be obtained by the yield (in percentage terms) of a longer dated government bond divided by a shorter term government bond. The chart below is a ratio chart consisting of the yield of the ten year U.S. government bond divided by the yield of the 90 day U.S. government bond (called the "Treasury bill" or "T bill" if you want to sound cool).


In "good" times, the ratio of the longer term rate divided by the shorter term rate declines, while it rises during a contraction (i.e. the "bad" times). When the bull market gets a little overzealous and everyone starts to speculate too much, the phenomenon of yield curve "inversion" can occur, which is when the short term rate goes higher than the long-term rate, which causes a ratio of less than one on the chart above. Once the yield curve inverts, the bull market top should occur within about a year or so, giving longer-term horizon investors plenty of warning that the good times and the current bull market of the day will be coming to an end. This time around was no different.

Monday, October 6, 2008

Are we there yet?

While I don't mean to discourage those hopeless optimists out there, it is important to look at where we are and where we're headed in the "bigger picture." We don't want to get swung around in circles by the latest Cramer rant or by the hopelessly clueless Ben Stein.

Long-term cycles do exist and the reason they continue to exist is because people haven't changed all that much when it comes to fear and greed. Every other generation has to re-learn the same old mistakes. You know the old quote about the history thing and being doomed to repeat it? While every cycle is a little different, the waves of prosperity, excess, and subsequent "cleansing" of the excesses built into the system during the "good" times continue to help us map out the macro-environment. The Dow-to-Gold ratio (see prior post on this topic for chart) is an easy way to play/see this cycle and allows you to ignore the question of inflation versus deflation.

But most of us like to watch and play in the general markets and would be bored to death hoarding a barbarous relic for 20 years. So, where are we in this wicked bear market and where are we going? To the charts, to the charts, I say. First, a long-term chart of bull and bear market periods in the Dow Jones over the past 100 years or so (Note: another cyberspace chart theft and I can't remember where I stole it from).


If we want to be optimists, we would say the secular bear began in 2000 and will end in 15 years (instead of 20). Thinking it will be shorter means you are thinking wrong. Thinking Bernanke will try to save your 401k means you are wrong, naive, and probably high. Next up, an INFLATION-ADJUSTED chart of the Dow over 200 years (from Stephen Williams).


This was last updated in 2003 and I can assure you that we have been heading down from the peak of the top channel line drawn on the chart since. Note that this chart exposes the ravages of inflation when comparing the 1966 to 1982 periods between these two charts. In other words, the only difference between the 1930s and 1970s in terms of REAL, inflation-adjusted returns is... ummmm..... not much.


Now for more recent events:


All major trend lines have not just been broken, they've been shattered. We shan't regain these trend lines again anytime soon. Minor support at 1000 and major support at 800 when looking at this chart from a longer-term perspective. Anyone hoping for a resumption of the bull market in general equities is related to Cramer and missing out on big opportunities to profit (and remember that stepping aside and moving to cash is actually VERY profitable in deflationary times because cash is king). Stay with the major, undisputable trend. The trend is your friend and it be down, yo...


I believe the S&P 500 will re-test (i.e. last seen in 2002-3) the 800 level within the next 1-2 years and it may come quicker than most of us can fathom. Are you prepared? From a more intermediate term basis, this leg down should be over by the end of the month. Notice the deeply oversold RSI indicator on the weekly chart. I don't think we're done with this leg quite yet, but 1-3 more weeks should do it. I got rid of my $SPX puts today at around the 1040 level, but may buy some back if we have a decent bounce for the next day or two. Could have just as easily held for another week or two, but the whole "pigs get slaughtered" theme kept popping into my mind this morning.


Sunday, October 5, 2008

Bonds - another indicator of deflation

I have been impatiently waiting for the long bond to break down and signal higher rates for the future. The fact that it just isn't happening solidifies my belief that we will have a deflationary-type period for at least 1-3 years. The long-term chart below demonstrates the current 30 year bond rate cycle versus the last one in the U.S.

I stole this chart but I don't remember where from so I can't give proper credit.


Remember, the bond market is larger than the stock market and is supposed to have more "sophisticated" investors. The 90-day T-bill has been under 1% for a while now, which is suggesting anything BUT inflation.

Commercial real estate - a dream short?

Below is a chart of the Down Jones U.S. Commercial real estate index ($DJUSRE) with a superimposed plot of the Dow Jones U.S. Homebuilder's index ($DJUSHB):


These charts so far look nearly identical with a phase shift. The homebuilder stocks peaked in 2005 and have tanked since (down as much as 75-80)%, while commercial real estate didn't peak until 2007. I circled the "dream" segment of a leg down in the homebuilder's index, which lost over 50% in less than 6 months. When shorting, remember that a 50% move down is similar to a 100% up move for those only used to thinking in the bull camp.


During the current cycle, peak prices for residential real estate/homes began before commercial real estate prices peaked, matching the stock cycles. I believe the charts will continue to show significant symmetry and so I positioned myself to profit in what I hope will be the strongest leg down for the commercial real estate bear market.


I bought January 2009 call options on an ETF (SRS) that is designed to try to provide the double inverse return of the Index in the chart above. In other words, if the $DJUSRE goes down 10%, SRS is supposed to go up 20%, although its tracking is far from perfect. Plus, I bought options on the ETF, making this a very leveraged play with plenty of risk if I am wrong. Friday, the $DJUSRE broke below its "head and shoulders" set up pattern and if I made the right call, the fireworks/"dream" leg down has begun.

The next play - gold stocks

Once we get the end of this intermediate bear market leg down that's causing everything except U.S. Treasuries and cash to go down, we will have a "recovery" bounce in just about everything. Currently, I have all my money in cash, gold and market shorts (shorting Bank of America (BAC), KB Homes (KBH), S&P 500, and commerical real estate via the SRS ETF).

I expect to cover my shorts (which are actually put options) before October is over and potentially as early as this week if the market has another big panic move down. Once I do that, I am going to use the proceeds to go long the gold mining sector.

I believe blue chip miners will go up 50-70% in a 6-7 month time frame once the general stock market intermediate term bottom occurs. Catching the exact bottom is impossible except through luck, and I'm not very lucky, but I only need to catch 70% of this coming move to make a bundle.

There are some charts and fundamentals that justify my belief in a coming big rally in the gold stocks. The first is that a deflationary environment actually benefits gold miners because the "real" price of gold generally rises, even if it's nominal price remains flat or even slightly declines. In other words, the schizophrenic nature of gold becomes exposed. Though gold is a commodity and an inflation hedge, it is also the oldest form of money, and cash is king in a deflationary environment. If you think of gold as money instead of as a commodity, think about what a boon deflation is for gold miners. Other commodities (like energy) and labor costs go down in a deflationary environment, so the cost of digging money out of the ground decreases and money becomes the world's most valuable investment during a deflation.

To get a proxy sense of the "real" price of gold, we can use a ratio chart that divides the price of gold by the price of a basket of commodities (the $CCI).


Notice the breakout to new highs, which I believe is the beginning of a powerful new leg up in this ratio, increasing miner profitability. Next, I want to show you a ratio chart of the price of a gold mining index (the $HUI or gold bugs' index of un-hedged miners) divided by the price of gold. When the chart is going up, gold miners are considered to be more highly valued than gold and vise versa.


As you can see, gold miners strongly outperformed gold itself in the first 3 years of the gold stock bull market, but have lagged the price of gold for the last 4 years. This situation is about to reverse. I have given my estimate of Elliott wave count for this chart, which must be a pretty clean chart for me to even attempt it. Bottom line if you're not into Elliott theory, the "correction" for miners relative to the price of gold is nearly over (i.e. the "C" wave is almost done) and the next leg up should be powerful and roughly 2-3 years. Looking at a gold mining index chart, such as the GDX/$GDM, it is clear that we are undergoing a major (rather than a minor) correction that I believe will complete before the end of November. Since I don't know exactly when the bottom is in, I am going to buy gold stocks once general stocks (i.e. S&P 500)are done tanking, as a severe stock market decline (which we are in now) often takes everything with it.

Below is a chart I found on www.gold-eagle.com (a great gold site), which shows how Homestake Mining, a major gold miner at the time, did during the greatest deflationary bear market of the last 100 years.


A few things are clear here. First, gold stocks did go down during the initial panic in 1929 and second, the most spectacular gains occurred after the final stock market bottom in 1932. However, the chart doesn't have a log scale and a trader could have bought Homestake in late 1930 for a roughly 30% gain over a few months, in early 1931 for a roughly 75% gain over six months, and then in mid-1932 for a 300% gain in 1 year. Because this will be the "first" leg up in the next wave of the gold stock bull market, we don't know exactly how big the move will be, but such is trading. If you're not into trading, you can simply buy the GDX, GG or AUY this fall and hold for 3 years to make lots of money while everyone around you is losing their shirt. Me, I'm going to lever up and go for the gold, selling at what I think is the end of this leg up so I can switch to shorting the market again next spring.

I plan to play this coming leg up by buying 2010 LEAP call options on a few blue chip miners including Goldcorp (GG) and Yamana Gold (AUY), as well as a smaller gold company called Royal Gold (RGLD). For those not as familar with the sector, I would recommend GDX, an ETF that holds a basket of mining companies (LEAP options can be purchased to leverage gains and risk and the basket eliminates the risk of picking the wrong company in the sector).

Real Estate

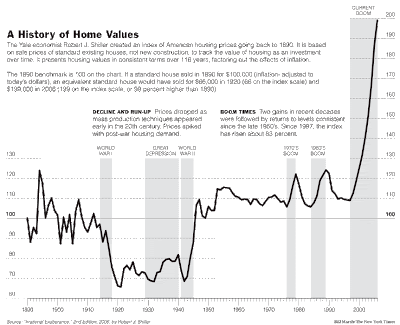
Yes, it was a massive bubble and no, it's not coming back. Your house is no longer an "investment," it is a liability and place for shelter. If you're waiting to buy at the current "great" prices, keep waiting. We're going down further - MUCH further. A few charts for visual illustration. The first is from Robert Schiller, an economist, and shows inflation-adjusted home values. This chart is a little outdated and the downturn from the current peak is obviously already underway.


The second chart is the Japanese experience with real estate, which for them peaked at the same time their stock bubble did - right around 1990. I copied this chart from another blog but can't remember where I got it.


Interpretation: expect real estate price in the U.S. to do a retrace all the way back to year 2000 prices. Here is a look at the Nikkei stock market, Japan's major exchange, from 1980-2008, with an overlay of the NASDAQ (our main bubble stock market that burst in 2000). Think 10 year lag but same ultimate outcome. History doesn't exactly repeat, but it does rhyme, eh?


How low will we go?

So it's a wicked bear market, but how low will the S&P 500 and Dow Jones go? The final target remains to be seen, but one target is easy to predict. We will re-test the lows of the last bear market set in 2002-2003. For the S&P 500, that means 800 and for the Dow Jones that means 7500.


We will probably reach these targets by the end of next summer, so we're talking about a 30% or so loss in the next year. Are you prepared?

The deflation versus inflation debate

Are we going into deflation or inflation? That seems to be a widely debated topic. I thought inflation would win out, but I was wrong. We're going into deflation for at least 1-2 years. The evidence is and was all there but I thought Helicopter Ben could work some more magic for another round. Now I don't think it's gonna happen (why the hell did I rely on a pseudo-bureaucrat to fix markets?!). This is going to be a wicked, deflationary bear market that is probably not more than half-way done. Though an intermediate-term bottom is likely coming within the next month for the major indices, it will be just that.


How can I be sure of the deflation argument? The chart below, which is from from Ned Davis Research, and the credit market events over the past 14 months.


The housing market crash has caused the debt bubble to begin its implosion. Defaults are accelerating (whether voluntary or involuntary and whether personal or corporate), banks are insolvent and hoarding money/tightening lending standards, the "shadow banking system" of derivatives is frozen, and the psychology has shifted to fear. Once a bubble like that shown in the chart above bursts, it ain't coming back. Notice the last time the debt bubble popped was in the early 1930s. In case you're wondering, yes, we are headed for a similar socioeconomic replay.

If you're not familiar already, now is the time to get into Elliott Wave theory via Robert Prechter and the gang at http://www.elliottwave.com/. I would recommend reading Prechter's book "Conquer the Crash" immediately if you have not done so. We've started the nasty "C" wave down and it's going to get ugly.

Inflation may certainly rear its ugly head once this deflationary collapse finshes, as our country is ripe for a good old-fashioned currency crisis once the dust settles. The guy at this link says it better than I can, but I envision a similar series of events ahead:(http://austrianenginomics.com/ADeflationaryCollapseFollowedbyHyperinflation.pdf)

In any event, the times ahead will not be pretty, and I'm not just talking about the stock market. This is not doom and gloom, this is preparing for a pending reality that has historical precedents in the United States.

Cash, gold and gold stocks, and going short the market are the best investment alternatives. Being a bull on general equities is the equivalent of financial suicide, though nimble traders can play the wicked bear market rallies that will occur. If you don't know what you're doing, SELL ALL YOUR STOCKS TODAY AND GET INTO CASH, preferably using short term government paper equivalents (i.e. 5 years or less duration federal government bonds). Stuffing cash and gold under the mattress for a year or two is a viable option as well. Remember, in a deflation, cash is king!

Wikinvest Wire