Tuesday, November 16, 2010

Scaling In and Signing Off


Scaled into long-term, near-the-money GDXJ calls with an expiration date of 2013 heavily today.

I am signing off on the blog. 600 posts over a little more than 2 years - a lifetime in internet terms. I am lacking inspiration for new ways to say "buy Gold and Gold stocks and avoid general stocks, real estate and fiat currencies." Since my short term timing has been terrible over the past year, there is little point in potentially misleading others out there with an interest in precious metals. Buy the dips in shiny things and buy the dips in the companies that dig shiny things out of the ground.

I wish all speculators and investors good luck in trying to maintain the purchasing power of their savings.

If I feel I have something useful to say, I will attempt to publish it on the "standard" alternative investing sites (e.g., financialsense, safehaven, goldseek).

The Dow to Gold ratio will reach 2 and may well get below 1 this cycle. The mania phase of this current secular precious metals bull market is ahead of us and the naysayers ain't seen nuthin' yet. If the unconstitutional, non-federal, for profit, private federal reserve and our gubbamint insist on inflating their way out of this mess, 5 digit Gold is not at all an unreasonable proposition.

Best of luck!


[Most Recent Charts from www.kitco.com]

Sunday, October 31, 2010

GDXJ Now Offers Long-Term LEAP Options


As if recent price action in the Gold price wasn't enough, there is now a tantalizing play on the Gold miners available for speculators in the junior Gold patch. Long term options (LEAPS) on the GDXJ ETF that expire in January of 2012 and January of 2013 are now available.

I remain a patient watcher of the Gold market and am still largely on the sidelines when it comes to Gold miners. On the next decent spike down in Gold stocks, however, I will be loading the boat with 2013 LEAP option calls on GDXJ. What's holding me back right now is the chart of the ratio of Gold to Gold stocks (using $HUI:$GOLD as a proxy) and what I believe is a short-term bottom forming in the U.S. Dollar. Here's a 10.5 year chart of the $HUI:$GOLD ratio thru Friday's close:


I think we are in correction mode in the Gold patch, just what's needed to cool the sector off a little. I think the next thrust up is going to be big in the Gold patch and I think Gold stocks are going to outperform. I am hoping a good opportunity to buy Gold stocks and more physical Gold presents itself before the year is over. I remain bearish on general stocks/the stock market, but am eagerly anticipating putting every penny of my speculative trading money into 2013 expiration bullish call options on GDXJ. I will be sure to post when I start buying.

Due to some new interests that will keep me busy for a while, posting will remain sporadic. I remain a rabid Gold bull for the long term. The Dow to Gold ratio will reach 2 (and may well go below 1) before the current secular Gold bull market is over.


[Most Recent Charts from www.kitco.com]

Wednesday, October 6, 2010

What Could Possibly Go Wrong?


One chart says it all (chart stolen from Market Harmonics):


There is no need for me to cheerlead in Gold, as everyone thinks this time is different and Gold is going straight to $2,000/oz. here. Perhaps it will. Wouldn't bother me a bit. Perhaps the stock market is going to new highs (that would bother me...). Perhaps hyperinflation has already begun but for the first time in history it is starting with bond yields at record secular lows. Perhaps Wall Street and Ber-spank-me can make stocks go up forever and at will.

Perhaps.

But perhaps this time isn't different. And perhaps the market is about to collapse. And perhaps the Dollar is about to stage a massive counter-trend rally that no one expects, just like in the spring of 2008 when everyone knew the dollar was going straight to zero.

I think we are set up for a 1937-style Dow / stock market collapse (chart stolen from sharelynx):


Everyone who though Ber-spank-me and widdle Timmy Geithner and the government would prop up markets forever in 2007 and 2008 now believes they are going to have better success this time around.

I own Gold because I believe we are in a deflationary depression and Kondratieff Winter. When apparatchiks try to "print" their way out (as they always do throughout history), the money simply makes it way into Gold, as there are no good macro-economic opportunities available to use all the money productively. There is always monetary inflation, but at this stage of the cycle, only Gold and Gold miners are poised to benefit from it. Though the rallies in risk assets have been fast, furious and at times relentless, another crash will make everyone remember where we are in the economic cycle. I'm just another guy with an opinion who isn't try to sell you anything, but I think we're set up for another massive market dislocation. Be careful out there.


[Most Recent Charts from www.kitco.com]

Wednesday, September 29, 2010

Portugal - Gorgeous Bear Pennant


For those who care, sorry for being away so long. I have been pre-occupied with other interests recently. Posting is likely to be sporadic for a while.

Silver has gone parabolic on a short-term basis and Gold is breaking to new highs on a daily basis. Things are obviously frothy and overbought here and now is not a time to establish new longs in the precious metals sector. I am rather enjoying the ride, however, as I don't trade my physical Gold. We will remain in a bull market in precious metals until the Dow to Gold ratio hits 2 (and we may go below 1 this cycle). Gold is good, stocks are bad.

My "long physical Gold, short stocks" trade is only half working (oops). We are back into nosebleed sentiment territory (again) in paperbug land, and I remain stubbornly uber-bearish here on equities. My favorite technical chart right now is of Portugal's stock market (using $PTDOW as a proxy). Here's a 20 month daily candlestick chart of the action thru yesterday's close:


Robert Prechter mentioned on an interview the other day that a recent daily sentiment reading on the U.S. Dollar was 98% bears. Since all fiat is trash, I am still looking for a powerful rally in the Dollar relative to other paper promises, which will throw stocks and commodities into a steep correction. A stock market crash is absolutely still on the table and risk is very high in common equities right now

Mr. Market keeps telling me the same thing: stop playing in the casino, put your casino money into physical Gold (and a little into silver), and sleep well. Some day soon, I may just listen...


[Most Recent Charts from www.kitco.com]

Sunday, September 12, 2010

Revisiting My Gold Stock Buying Plan


I was wildly bullish on Gold stocks during this winter and spring. I am now in watchful waiting mode, waiting to accumulate Gold stocks at a cheaper price. I have been more focused on shorting the S&P 500 over the last few months, but I watch the Gold sector every day.

I don't trade physical Gold, but I am always looking to accumulate more on weakness if I have cash on hand. I don't own Gold miners, I trade them. I don't think buying and holding Gold miners is a bad idea at all this secular cycle, but I have chosen to buy and hold the Gold sector via physical metal and to trade the Gold sector using the miners. It is a personal choice, as we all must make when investing and managing our own money.

I "gave up" on the long Gold stock trade in May, when Gold stocks failed to show the strength relative to the metal price that I thought they would be showing if we were on the verge of a major cyclical bull thrust higher. I am bearish on equities in general, but Gold stocks can move higher despite a falling general stock market and have many times in the past. I am more concerned about the Gold miners' lack of relative strength compared to the Gold price than I am about a stock bear market.

I created my own thesis and "road map" for the anticipated Gold stock (as a sector) correction back in May. Since that time, the major Gold stock indices (i.e. $HUI, $XAU, GDX) have made a kind of triple top formation, while the junior sector, using GDXJ as a rough proxy, has broken about 5% higher than its May highs. In other words, pretty much sideways action, but the sector has not yet corrected as anticipated.

The point of corrections is either to "scare you out" (i.e. price plunge) and/or "wear you out" (i.e. take a long time moving little in either price direction). Of course with Gold stocks, even a "wear you out" correction can have 10-30% swings in either direction. C'est la vie in the Gold patch.

Only time will tell if my anticipated correction in the GDX ETF down to the 40 level will prove correct. For now, I am watching and waiting for a better opportunity in the Gold stock sector. Why? Because Gold stocks are still underperforming the Gold price, and this is corrective-type action in my opinion. Couple this with my uber-bearish outlook on the stock market right now and I continue to believe that Gold stocks are headed for a significant correction. This is not a bearish outlook, this is cash on the sidelines looking for a better entry point. I may get it, I may not (such are the risks of speculating). If I get it, I will be betting the family farm from the long side using long term LEAP-type options on GDX and potentially on a few individual miners. I also plan to go long GDXJ as well if I get my anticipated correction, but to a lesser extent since this ETF doesn't offer long term options.

Here is the chart that keeps me from being bullish on Gold miners right now, a 2 year daily chart of the $HUI mining index divided by the price of Gold (i.e. $HUI:$GOLD ratio chart):


This analysis is irrespective of the general stock market and stands on its own. Couple this with a "toppy" looking Gold chart (1 year daily $GOLD candlestick plot):


For those who can't see how Gold could possibly correct here, have you seen the latest Commitment of Traders chart for Gold futures (if not, check here)? Lots of paper chasin' momo hedgie quants in on the "long paper Gold" trade right now, just waiting to hit the sell button at the first sign of trouble.

I remain wildly bullish on Gold and Gold stocks for the long term. I remain wildly bearish on equity markets for the intermediate term. I remain in bored and watchful waiting mode when it comes to the Gold patch for the short term until I see a meaningful correction, which I am thinking (hoping?) will complete before the year does.


[Most Recent Charts from www.kitco.com]

Monday, September 6, 2010

Deja Vu All Over Again


This chart should cause a sense of dread for all the retail investors left that are still still holding and hoping when it comes to general equities (chart stolen from a recent piece by Carl Swenlin):


Mutual fund managers, in aggregate, are like retail investors. There is no added value provided by these managers when reviewing this chart. Highest levels of cash occurred at the bottom, lowest levels of cash at the top. The August 2010 level is actually a record low percentage of cash over the past 5 years.

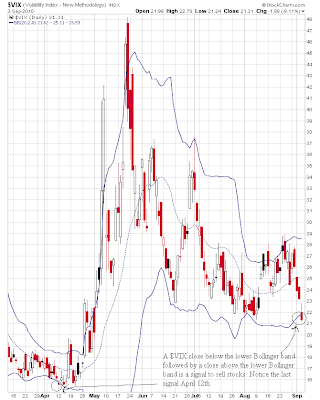
We are also set up to have a Volatility Index ($VIX) sell signal on stocks:


Equity put to call ratios remain at low levels for an equity bear market (i.e. levels that mark a stock market top, not a bottom). I think the current short squeeze will run out of steam this week, creating a significant top before a devastating plunge.

When it comes to Gold, I remain firmly committed to the long side via physical Gold that remains my largest holding. I am not interested in Gold stocks right now as I am skittish on all equities here. However, I am VERY bullish on Gold equities for the long term and hope to accumulate on weakness this fall. Gold stocks continue to underperform the metal, which keeps me in conservative mode and continues to make me think we are still in a consolidation phase for the short to intermediate term. I continue to think the U.S. Dollar is going to have another major rally to the upside this fall despite its horrible fundamentals.

I am still heavily short the S&P 500 via puts on the triple bullish UPRO ETF. The only changes I have made to this position are that I sold some puts as a hedge against my position and cashed this hedge out, using the proceeds to add to my short position on Friday. So, I am more net short now than I was a week ago.

When the mutual fund redemption requests start pouring in again on the next drop, mutual fund managers will have to sell significant amounts of stock due to their low cash positions. This, along with the lack of the uptick rule and the heavily computerized trading currently going on, will create an avalanche of selling this fall in my opinion. I think the herd will be forgetting about the confirmed Hindenberg Omen on the books at just the wrong time. Though I think we could have another up day or two this week, I am keeping my crash helmet on for the fall.


[Most Recent Charts from www.kitco.com]

Sunday, August 29, 2010

Remember, Remember, It's Almost September


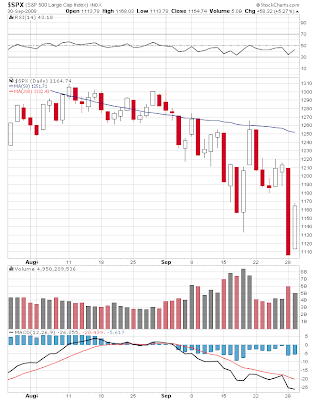
September is historically the worst month for the stock market. The stock market internals continue to weaken and I am keeping my crash helmet on for now. A few fractals in terms of September fireworks follow for those with a current bearish inclination towards equities like myself. First up, 2008 in the S&P 500 ($SPX):


Next up, 2001 in the S&P 500:


Or, an example from way back in 1946 (copied from chartsrus, a great site):


I think ol' Uncle Buck has a fall surprise in store for U.S. Dollar bears (again) and I think this will cause almost all asset classes to fall in a brief deflationary type drop. I am ready with cash, hoping to pick up some Gold miners on sale. My target level remains 40 for the GDX ETF and I expect to get there in the next 1-2 months. I think a disorderly move down in stocks is coming when "Wall Streeters" get back to their desks after Labor Day.


[Most Recent Charts from www.kitco.com]

Thursday, August 26, 2010

Secular Chart Porn - The View From the Top of the World


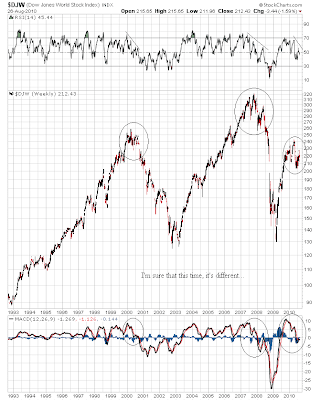
The global equity market world, that is, using the Dow Jones World Stock Index ($DJW) as a proxy:


The global stock markets of the world are going to be much lower a year from now. For the intermediate term, get short or get into ultra-safe cash equivalents (i.e. physical Gold) in my opinion. Ben Ber-spank-me and all his digital soldiers can't keep this Hindenberg afloat. We are in a classic secular equity bear market and the bell at the top rang during the "flash crash" in May. It's a long way to the bottom regardless of your opinions on the FOREX/fiat currency swings (ask Europe if a rapidly depreciating currency stopped their crash in 2008).


[Most Recent Charts from www.kitco.com]

Tuesday, August 24, 2010

Nikkei Breaks Down


The Japanese Nikkei stock index ($NIKK) broke important support today. Here's the chart, which shows it better than I can tell it (18 month daily candlestick plot):


And for those who think technical analysis is worthless, I ask how many fundamental analysts have had the same track record as the 200 day moving average for the $NIKK over the past 18 years:


The last chart I highlighted with a similar important breakdown was Ireland (see recent post here and older post on Ireland here). Ireland's stock market (using $IEDOW as a proxy) was down over 6% today, so don't think what happened today in Japan's stock market isn't important.

Gold had another great day while Gold stocks had another lousy day. I continue to wait patiently to get my greedy hands on some Gold stock indices at a lower price. In the mean time, I remain long physical Gold and heavily short the stock market. The next few days have the potential to be quite interesting...


[Most Recent Charts from www.kitco.com]

Friday, August 20, 2010

Ireland - First PIIG to Break Down


As the disintegration of paper continues, leaving shiny Gold holders with their wealth intact, it looks like Ireland is leading the so-called "PIIGS" into the next leg down in the bear market (see prior post here). This morning, it's stock market broke below it's spring lows.

Here's a 60 minute intraday chart of the action of the past 6 months in the Ireland stock market (using $IEDOW as a proxy):


Fellow squiggle watchers on this side of the Atlantic are making a mistake if they think this isn't relevant. The panic will likely again come out of Europe, which may cause another nasty round of deleveraging in equities and cause the U.S. Dollar to do another zombie death rattle higher. This time, I think Gold holds the line better than in 2008 and I wouldn't be surprised to see it go higher (with potential nasty volatility along the way).

Greece is already at the March 2009 Armageddon lows and threatening to go deeper into the abyss. The rest of the world will follow. I am staying long physical Gold and short the U.S. stock market. The Dow to Gold ratio will reach 2 before this mess is over and we may go below 1 this cycle.

Though it may seem at times as though I am rooting for bad things, I am simply pointing out the natural cycle that mainstream media won't ever tell you about. We must cleanse the rot in the system before a new cycle of prosperity can begin. We have a long ways to go in the "cleansing" cycle when it comes to "traditional" financial assets like stocks and real estate. In the mean time, Gold will flourish and Gold stocks will provide a speculative vehicle for bulls seeking higher risk (and its associated higher potential rewards).

[Most Recent Charts from www.kitco.com]

Friday, August 13, 2010

Gold in a Bull Market, Stocks in a Bear Market


To me, the title is stating the obvious. To many, such talk is ridiculous. To paperbugs, Gold is a bubble about to pop and only stocks make you money over the long haul. To paperbugs, capitalizing the word "Gold" labels me a tinfoil hat wearer, while to me, capitalizing the phrase "federal reserve" (not federal and has no reserves) is blasphemy. How supremely ironic that everything the ex-American presidents Jefferson and Jackson warned of when it comes to central bankstaz has come to pass and yet their countenances grace the $2 and $20 federal reserve IOU-nothing notes.

I am short the Dow to Gold ratio. It was the easiest and best trade of the last decade and it has much further to go - we will reach 2 and we may well go below 1 this cycle. Paperbugs scoff at such a notion just as they did at the turn of the century, but they have been so wrong they should be ashamed to prognosticate and comment on anything financial.

If you listen to the staff at mainstream media outlets (i.e. General Electric is now a bankrupt financier dependent on government largesse for survival), you just might be a sheeple. Cramer says "buy" because if he didn't, he'd be out of a job. Ben Stein is ignorant and complacent because that's what he's paid to be.

Those who say the "stimulus" failed are as wrong as can be. It worked remarkably well in continuing the keiretsu fascist business model that now plagues the senior economies of the world. Corporations have stolen hundreds of billions from the taxpayer kitty and are ready to take more on the next market plunge - which part of success did I miss? At least China and Russia admit to central planning. Small businesses are screwed, which means Main Street is screwed. No small businesses, no real jobs. Government, Inc. is the only large corporation that is creating a significant number of "jobs" for people who actually live in America.

One can choose reality or not. Truth is difficult for most when it isn't rosy. I guess I am comfortable in being a bear. I am comfortable shorting America as a trade and investing in real money (i.e. Gold) during an economic depression. We can't possibly double dip when the first recession of this new economic depression/secular credit contraction/Kondratieff Winter never ended. But we can see lower real estate and stock prices. And we can also see lower commodity prices due to a weak global economy.

Gold is in a bull market. It is unequivocal on a long-term chart and anyone who says otherwise doesn't know how to read a chart. Period. You can call it a bubble if it suits your sour grapes, but the trend line has not been broken. U.S. government bonds are also still in a bull market, which is also unequivocal. How many Gold bulls feel comfortable with this latter comment? How many Gold bulls are comfortable with Exter's pyramid? Hyperdeflation and hyperinflation are not as far apart as many like to think. Ice first, then fire, as federal reserve notes will be the last major asset class to hyperdeflate relative to Gold (the past deflation of private, for-profit, fascist, IOU debt notes backed-by-nothing relative to Gold has been just the warm up).

It is the monetary system that is breaking down. For those who think such tumultuous times will bring higher stock prices, I say "maybe." Ask Europe if a rapid currency decline relative to the rest of the world has been kind to their stock market over the past few years. Gold is money. Fiat paper backed by unpayable debt is a secular illusion that will be corrected by this secular equity bear market, which is far from over. No, you can't spend Gold at WalMart (yet), but you also can't eat T-Bills without a lot of hot sauce and mustard (Gold is a delicatessen on the other hand).

Of course Gold will continue to go higher when priced in federal reserve notes during the current debt/credit collapse. Of course Prechter is wrong about what money you should be holding onto for dear financial life. The mainstream media wants you to be confused about what Gold is and so most are. Gold is a currency. Yes, it can rise during inflation, as can any asset (or any currency not being debased by apparatchik madness) during a generalized inflation. But during a secular credit contraction, confidence is lost in those who hold the reigns of power as well as those in the private business world. Where can one turn in such an environment?

Since we are already there (just not at the bottom yet for stocks or real estate), the answer is right in front of your eyes: Gold has outperformed fiat paper IOUs (whether Dollars or government debt), but fiat paper IOUs have outperformed stocks and real estate. Commodities are somewhere in the middle, but I wouldn't want to be worrying about peak resources just yet: global economic collapse has a way of slowing demand for raw materials and energy.

My positions are simple right now: long physical Gold and shorting the stock market. Right now, my interests lie with shorting the stock market, since my physical Gold just lays there, looking all shiny and what not while increasing in purchasing power every year like clock work. For those who scream confiscation, I can only give them a patronizing smile. More paperbug sour grapes for missing the boat. I would rather have a 99% tax on a gain than a 0% tax on a loss and I lost all my Gold in a poker game (to a Mr. Karl Denninger) if the confiscation order comes down from above.

We are in a perfect position for a stock market crash and Friday's action did nothing to mitigate this. Yes, we may not get the big move until October, but an unconfirmed Hindenburg Omen on Thursday straddled by two near misses on Wednesday and Friday should make any seasoned trader willing to consider the evil bear side salivate, particularly in light of the hard economic realities lurking behind the financial markets. Stocks are way over priced using traditional metrics. No, I am not talking about price to estimated future operating earnings and, yes, excluding mark-to-fantasy accounting - Japan tried this latter scam in the early 1990s to prop up their large banks and how's that working out for 'em? Even the stars are aligned correctly for a major bear market move!

I remain with Richard Russell, Arch Crawford and Ian Gordon on this one - a hard rain's a comin' to a stock market near you, so batten down the hatches.


[Most Recent Charts from www.kitco.com]

Thursday, August 12, 2010

The Summation Index RSI Indicator


Trading is difficult and the odds are stacked against you. Any edge you can get when trying to figure out when to buy or sell helps. I have found the RSI on the New York Stock Exchange Summation Index ($NYSI) a helpful swing-trading tool for this ongoing equity bear market, which I believe resumed when the "flash crash" occurred in early May. I am currently short the S&P 500 using December expiration puts on the triple bullish UPRO ETF.

Simply put, when the RSI on the $NYSI reaches the 80-90-ish level in a stock bear market, it is time to consider establishing short positions and when it gets to the 10-20-ish level, it is time to consider closing them out. No one indicator is perfect, but this is a good medium term (1-3 month time horizon) indicator in my opinion (I made it up, by the way - more free original technical research from your pal at Gold Versus Paper). A picture is better than my words, so here's this "indicator" in action during the 2007-2009 bear market (a plot of only the RSI for the $NYSI is shown with the price action for the S&P 500 [$SPX] plotted on top of it):


And here's a slightly easier on the eyes and brain chart of the past 6 months with the RSI for the $NYSI plotted above the main $SPX chart and the $NYSI itself plotted below:


We'll see if it works out this time. I will be adding more to my short position on the first decent bounce (i.e. when the RSI gets over 50 on a 60 minute intraday chart of the S&P 500).

Gold remains firm based on its safe haven status - it continues to act as a currency. I am expecting some short-term volatility (i.e. BUYING OPPORTUNITY!) but sleep very well knowing I have a strong core physical Gold position. I remain wary of Gold stocks over the short term, as they continue to act weak relative to the price of Gold (though they continue to show relative strength compared with general equities as expected) and because I am still expecting a stock market melt down.


[Most Recent Charts from www.kitco.com]

Tuesday, August 10, 2010

Calling the Top in Global Equities


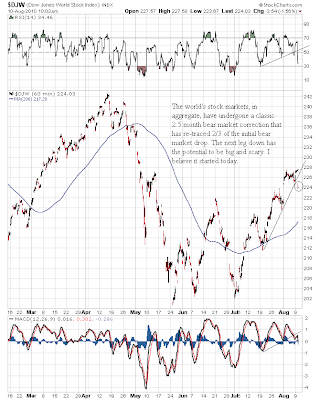
Top-calling is a fun exercise as long as one doesn't take it too seriously. I have been black bile bearish on equities for several months now. I think the bear market bounce is over when it comes to global equities. Let me show you a 6 month 60 minute intraday chart of the Dow Jones World Index ($DJW), which I use to track global stocks in aggregate, thru the early part of today's action (see prior post regarding $DJW):


Now, this doesn't mean that the top is in for every individual stock market index in the world - far from it. However, no global stock market will be spared in the next global equity plunge. The U.S. Dollar looks like it is trying for a trend change here, which likely means it is time for "risk off" among the suit and tie crowd in New York (6 month daily chart of the UUP ETF as a proxy to allow me to chart this morning's action):


I am only partially positioned on the short side. If we get one more pop to the upside in the S&P 500, I will be shorting the $%#@!* out of it. I think Gold will hold up fine when one looks a few months ahead, but some volatility would be expected and normal if we get into another stock market crash, which seems entirely feasible and reasonable this fall. I will be looking to buy Gold stocks hand over fist if they plunge as I am anticipating.


[Most Recent Charts from www.kitco.com]

Sunday, August 8, 2010

The Unshakable Faith in Magic Market Wizards


I see what I think is the same faulty herd mentality developing in financial markets that hammered investors in 2007-2008. This is the belief that infallible bankstaz and bureaucrats can create price levitation in any and all asset classes at will. Not only that, but the success rate of these manipulative, magical wizards is so high that you shouldn't "fight the fed" to use one oft-quoted phrase.

Yes, there is market manipulation. Yes, it occurs in every market. Wall Street has never presented a fair game to retail investors since its inception. Nobody said the game was easy. If you don't want to play, buy physical Gold, keep quiet about it and store the physical metal outside the financial system.

However, the belief that the federal reserve is all-powerful or the plunge protection team won't let markets fall is beyond ridiculous. This magical belief in secret forces that control all markets will never go away, but it has become more acute recently. Everyone in the market is trying to manipulate it! The larger the player, the larger the influence. However, the larger players are also more easily trapped in their positions due to a lack of parties able to take the other side of the trade. Ask the Swiss central bank how well currency manipulation works when Mr. Market has other ideas.

The federal reserve and U.S. government failed to stop the biggest bear market in roughly 40 years during the 2007-2009 time frame despite throwing the kitchen sink at it. Does everyone forget that before the prior cyclical bear market picked up steam that financial firms were bailed out, the entire U.S. mortgage market was nationalized, the fed cut interest rates aggressively and short-selling was banned? The amazing response of some of those steeped in market manipulation lore is that the bear market was caused on purpose by the same organizations that used all their resources to prevent it!

If the bear market was caused on purpose by the fed and their Wall Street cronies like Goldmun Sucks (ticker: GS) and JP Whore-gan (ticker: JPM), why did GS and JPM fail spectacularly in the crash and need a bailout to survive? GS and JPM are only ongoing concerns right now because they were bailed out by the fed and government. This isn't fair, but it ain't exactly new in the history of financial markets and doesn't really suggest a pre-meditated crash (wouldn't GS and JPM have made billions shorting the market if they saw it coming/caused it?).

Please don't misunderstand what I am saying. I am not saying that the fed and large Wall Street firms aren't powerful. They absolutely are and they absolutely abuse their power and cheat, lie and steal. But financial markets have been rigged since their inception hundreds of years ago. This manipulation cannot change the primary trend.

The bear market is getting set to resume in my opinion. This opinion is based on technical and fundamental analysis. I may be wrong in my opinion, but if I am, I certainly won't blame it on market manipulation. And I won't blame it on "QE II" or some new government policy to make it illegal to pay your mortgage. If I am right on my market call, however, hopefully it will convince a few more market participants that central bankstaz and their respective governments and keiretsu financial firms are not all powerful.

In fact, I believe it is one the jobs of this secular stock bear market to reveal how truly impotent our "masters" are to stop the carnage partially caused by their prior reckless policies.The Dow to Gold ratio will reach 2 (and we may go below 1 this cycle) before the ongoing secular stock bear market is over and the magical wizards are powerless to stop it.


[Most Recent Charts from www.kitco.com]

Saturday, August 7, 2010

Gold and Bond Prices Up - Must Be a Kondratieff Wave Winter


I am a Gold bull. I believe we are in a Kondratieff Winter or secular credit contraction. This is a very different view than many Gold bulls have, which revolves around the theme of "U.S. Dollar goes to zero, Gold and silver go to infinity." De-leveraging is very different than heavy, persistent inflation as a secular theme. But anyone long Gold will be right regardless of their reasoning. I will be buying more Gold if it gets to the $1150 level.

My main focus right now is on shorting general equities, however. I think the next leg of the stock bear market is imminent. I think it will occur in the setting of a rising U.S. Dollar and falling commodity prices. Since many investors and speculators see Gold as just another inflation hedge like copper or oil, I believe they will dump their Gold positions, creating another short-term buying opportunity for me in physical Gold. I may be wrong, but I am in no hurry to buy more Gold now that I have a large, "strong hand," core position.

Secular lows in the yields for U.S. sovereign debt (i.e. world's senior economy) at the same time Gold is at secular highs does not fit into a neat "deflationist" or "inflationist" box for those who think in paper fiat terms, but it fits a Kondratieff Winter like a glove. I believe asset price deflation has been ongoing and rather obvious since 2000, but only when the currency used to "demonstrate" deflation is Gold. The debt-based global fiat system distorts the picture significantly.


Now, in any monetary system ruled by bankstaz and their lap dog governments, the way out of the predicament is simple: destroy the value of the currency. However, the time line for such a "managed" versus chaotic free market adjustment to the value of the currency is unpredictable. How can one say the complete destruction of the U.S. Dollar will occur before the year is over with a straight face? Japan proves that obviously unsustainable government debt can take quite a long time to manifest as a serious currency event. No, the U.S. is not Japan, but we're not Zimbabwe either.

Taking "a stand" on the inflation versus deflation debate is as useful as taking a stand on the Democrat vs. Republican issue. Obviously, inflation will always win over the longer term cycles when a currency is not fixed rigidly to Gold. But this does not help the trader or speculator. It is important to recognize what is in a secular bull market (Gold, U.S. debt) and what is in a secular bear market (general equities and real estate).

When the current cycle is over, Gold will have outperformed cash. Why? Because no matter what happens, the nuclear option will always be on the table and the worse things get, the more palatable it becomes. The nuclear option always works from the viewpoint of a government or banksta. What is the nuclear option? Currency destruction. Those who say you can't devalue in a global, anchorless fiat world are naive and lack imagination. A global "trade" currency, whether or not backed by anything tangible, would allow everyone to devalue in spurts and fits relative to this "trade" currency. Nefarious organizations like the IMF stand ready to take on the task.

Gold has been and will continue to act as a currency in this ongoing saga. It remains the currency of last resort and we are getting close to a time when that last resort will be used to do what Gold has always done: reset the monetary system (for better or worse). Gold is the strongest currency in the world because it is immune from (and benefits from) the nuclear option. Gold is my largest position because it is the only no brainer long term investment for the current cycle. The purchasing power of Gold will continue to rise as the secular credit contraction grinds onward and destroys the bloated prices of things sustained by debt in the prior cycle (e.g., common stocks and real estate).

These big picture themes keep me focused and are obvious on long-term price charts. However, such themes are no fun for the trader/punter that seeks to profit from shorter term swings. These swings have nothing to do with the fundamental long-term themes described above. Not recognizing the difference between short to intermediate-term technical swings/moves and long-term secular trends can cause one to lose a fortune when playing in the casino (trust me, I know).

I am not recommending a speculative approach at all, but I use such an approach with a portion of my capital. Most with excess savings would be best served by buying physical Gold, holding it outside the financial system and waiting for the storm to pass. Once the Dow to Gold ratio gets to 2 or less (we could go below 1 this cycle), selling most of one's Gold position and buying equities "for the long term" will make sense unless one is thinking in multi-generational time frames (i.e. keeping some family wealth in the form of physical Gold to be passed on to future generations without telling the tax authorities).

All the short-to-intermediate term charts I follow for trading purposes are now stretched and looking for a catalyst for another trend change. I am hoping to load up on shorts this week, but will only take the trade if the opportunity presents itself. Here are a few short-term charts with my thoughts. First, the copper to Gold ratio (using JJC:GLD as a proxy to allow intraday charting) over the past 4 months using a 60 minute intraday plot:


And here's a 6 month chart of global equities using the Dow Jones World Stock Index ($DJW) as a proxy (60 minute intraday plot thru Friday's close):


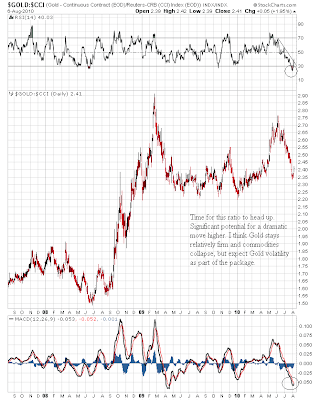
Following is a 3 year daily chart of the Gold ($GOLD) to commodities (using $CCI as a proxy) ratio thru Friday's close:


The anticipated upward move in the Gold to commodities ratio chart above is bullish for Gold stocks, but only in a fundamental sense, not a trading sense (i.e. a rising Gold to commodities ratio often occurs as Gold stocks are falling, at least initially). Gold stocks continue to lack leverage to the Gold price and I believe they will be transiently caught up in what I think will be a big move down in the world's stock markets. I continue to wait patiently for what I think will be a dramatic buying opportunity in Gold stocks within the next few months. I will be buying Gold stock indices hand over fist if senior indices decline about 20% from current levels (e.g., looking for GDX level around 40). This week, though, my focus will be on building a big equity short position primarily using puts on the triple bullish UPRO ETF that tracks the S&P 500.


[Most Recent Charts from www.kitco.com]

Wednesday, July 28, 2010

Unrepentant Gold Bull and Stock Bear


Looking to buy more physical Gold with one more price dip and looking to short the $%&@*! out of equities with one more price rise. I will be scaling into both positions. With Gold, it will be purchase of physical Gold starting at $1150. With the stock market, it will be primarily via puts on the UPRO triple bullish ETF that tracks the S&P 500 and also some puts on the triple bullish commercial real estate ETF (ticker: DRN).

I actually like the "pan-European" Dow Jones Europe Index ($E1DOW) for a good road map of where global equities are headed, as it has a "clean" chart that gives a good "big picture" overview. Here's a 12 year weekly log scale chart of $E1DOW to show you what I mean:


Perhaps another week or so to squeeze the remaining bears, but then it's showtime. I am waiting for one more significant up day to start scaling into short positions and will likely be using the December contract on UPRO and November contract on DRN. High-risk play with major leverage and potential for major rewards/losses. If you're going to bother playing in the rigged casino, you might as well make sure victory pays well.

When it comes to Gold, this is where I invest. This is where I put my savings. Trading is my "get rich or die trying" money (the hare), Gold is my safe and can't lose money (the tortoise). Not that Gold can't rocket higher and make me 50% in a year, but I don't use leverage, I don't trade it and I simply buy the dips. Gold stocks are just another paper play in the Wall Street casino. Those who think otherwise are ignoring shareholder dilution, ridiculous management pay, political risk, and the current lack of dividend yield that plagues the sector. I believe Gold stocks are for renting rather than owning at this point in the cycle unless you are a mining and financial expert who knows how to analyze a company from the ground up and stay in touch with day-to-day operational concerns or a very long-term investor unconcerned with severe draw downs.

Now once I think general equities are done collapsing, different story. I will be buying Gold stocks hand over fist on the next panic bottom. For now, I am putting my "safe" money into a safe investment. The only currency that can't be debased by decree. The only market besides U.S. debt that remains in an unequivocal bull market. However, U.S. debt is an accident waiting to happen while Gold is getting ready to go into its manic bull phase. You won't find me dabbling in the bond market, though I pay attention to it.

The difference between an equity chart of any country in the world and a long-term Gold chart is striking and shows where we are in the "big picture" type cycles that are important for most investors to focus on (12 year log scale weekly chart of $GOLD follows):


Bond yields at secular lows and Gold at secular highs is a hallmark of a Kondratieff Winter and is not seen in any other season. We are in a K-Wave Winter. It ain't close to being over yet.

The Dow to Gold ratio has been screaming higher along with the copper to Gold ratio and both are due for a reversal in the next week or so IMO. Here's a daily 1 year chart of the Dow to Gold ratio ($INDU:$GOLD) thru today's close:


I am in the Ian Gordon camp here. Banks won't even admit people are delinquent on their mortgages any more! Another collapse is coming - only the timing is in question. "Extend and pretend" works until it doesn't and then the first one to panic wins. True value for the S&P 500 is at 500 or less (500 is the optimistic scenario) and we will get there. I continue to wait patiently for a better buying opportunity in the GDX and GDXJ Gold stock ETFs (my road map for when I'll be buying Gold stocks can be found here). The Dow to Gold ratio will reach 2 and we may well go below 1 before the current cycle is over.

Sorry for the sporadic posting, but it's summer and all...


[Most Recent Charts from www.kitco.com]

Thursday, July 22, 2010

Another Day, Another Lesson


Uncle Buck trying to break down again and copper is ripping higher. The base metal miners are confirming. From overconfidence to fear, I feel like a sucker right now. I decided not to let profits turn into losses and cut bait this morning on my short positions, barely squeaking out a profit. Plan to watch from the sidelines in cash for now and re-load on shorts if we manage to get higher. Ahhhh, life as a novice trader.

I am now in my largest cash position in months in my trading account. Still waiting patiently for lower Gold prices before buying more physical and still waiting for the Gold miners to come to papa. These are all short term considerations, of course.


[Most Recent Charts from www.kitco.com]

Tuesday, July 20, 2010

Waiting Patiently With Confidence


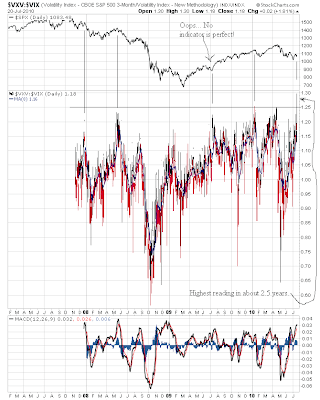
This chart blows me away. It is a ratio chart of the $VXV (the 3 month CBOE predicted volatility) to the $VIX (current volatility). When this ratio is higher, it means the current $VIX reading is lower than what futures traders anticipate the volatility will be in 3 months. In other words, a higher reading in this ratio is a bearish signal, as it indicates complacency in current investors relative to the anticipated volatility in 3 months. Since the latter "guesses"/bets are traditionally only made by "sophisticated" market players, a high ratio suggests too much complacency. The caveat is that a ratio chart can move as both components trend in the same direction at different rates. Anyhoo, here's a roughly 2.5 year chart of the $VXV:$VIX ratio on a daily candlestick plot (as far back as my data goes) versus the S&P500 ($SPX, upper plot) during this time:


The bond market is screaming higher and the world's biggest bubble apparently has more deflationary medicine for us before it pops. The five year yield is screaming towards the lows made during the March 2009 stock bottom (18 month daily chart thru today's close follows):


Another deflationary wave is coming when it comes to the pragmatic version of deflation: falling asset prices (and thus a rising value of cash / increased purchasing power for Gold). I know this ain't the academic version of what deflation is, but I am trying to make money here and I could care less if the monetary base is expanding when all I really want to know is if stocks and commodities are going to tank again (they are IMO). Many Gold bulls will get scared on a price correction instead of viewing it as a buying opportunity. Gold is money. Gold thrives during a hyperdeflation.

Patience is no virtue when you're holding onto options, given the time decay. However, I continue to wait patiently for the next market meltdown while holding puts against the S&P500 and commercial real estate and I also continue to wait patiently in paper debt-based cash to buy more real money (i.e. Gold) and to buy Gold miners at a lower price. The Dow to Gold ratio will reach 2 before the secular stock bear market is over and we may well go below 1 this cycle.


[Most Recent Charts from www.kitco.com]

Sunday, July 18, 2010

Imminent Waterfall Decline in Commerical Real Estate

GoldMoney. The best way to buy gold & silver


Only an evil speculator would bet on a price collapse. And once you place your short bet, you become evil (unless you work at Goldmun Sucks, and then it's God's work). I have been anticipating a steep fall in commercial real estate stock prices. The current ratio chart between the $RMZ (a commercial real estate index that underlies the DRN and DRV ETFs) and S&P500 ($SPX) has me drooling in greedy anticipation of the next big move:


The reason I am excited about the prospect of this happening is not only the fact that I think this ratio plunge will occur while the stock market is falling, but also the two prior precedents in the commercial real estate bear market using ratio charts of $RMZ to $SPX. Here are two ratio charts (a daily 4.5 year chart followed by a weekly 6 year chart) to show you what I mean:


I am VERY biased because puts on the triple bullish DRN ETF are my largest current trading position, but I smell a waterfall decline coming soon in the stock prices of the commercial real estate sector. I remain black-bile bearish on all equities currently and think all stocks are going to tank over the next month or so, including Gold stocks. I don't think the first leg down of the return of the general stock bear market is done yet. I am keeping my stock market crash helmet on here and clinging tightly to my physical Gold (as well as some, ugh, U.S. Dollar cash in anticipation of buying more physical Gold and Gold stocks at lower prices).

The Dow to Gold ratio will reach 2 before this secular Gold bull market (and secular equity bear market) is over and we may well go below 1 this cycle. Since Gold is going to continue to outperform the U.S. Dollar as it has for the past decade, Gold is a better form of cash to hold if you prefer to sit on the sidelines and watch the rest of this secular mess rather than try to trade it.


Buy gold online - quickly, safely and at low prices[Most Recent Charts from www.kitco.com]

Wikinvest Wire